Knowledge Bank
Crypto Bullruns Past and Present
Apr 2024
By Kairon LabsKnowledge Bank
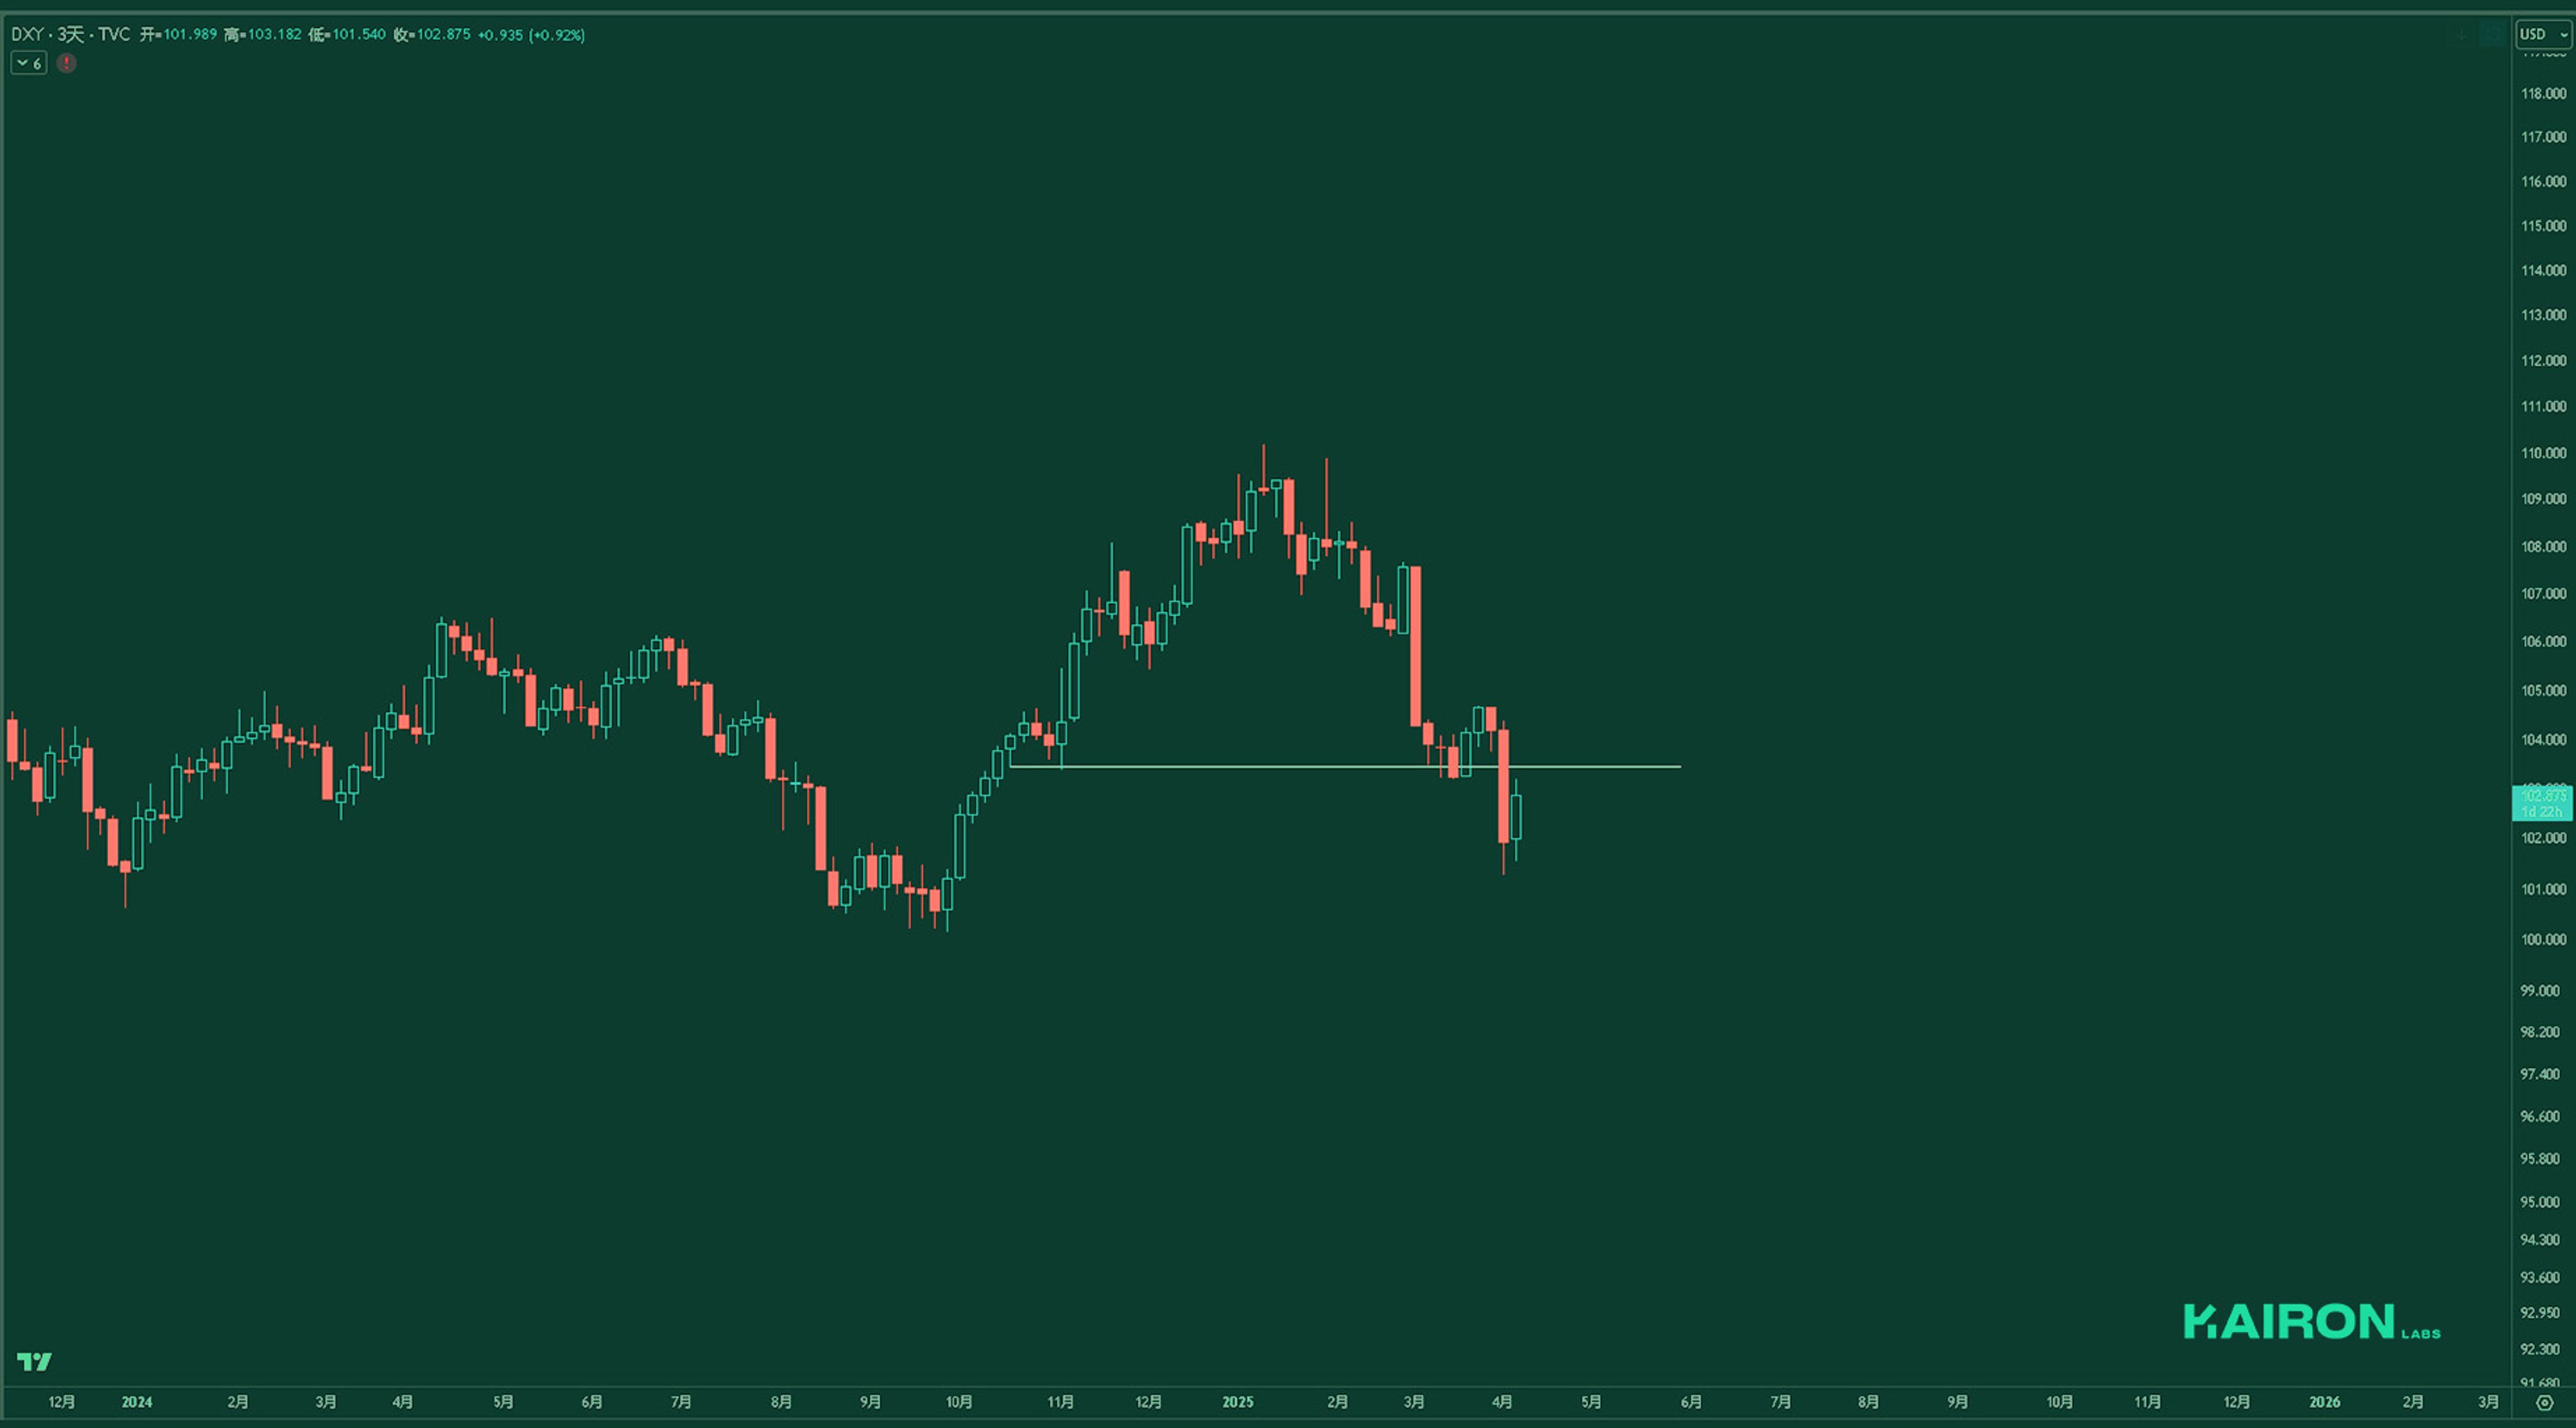
The DXY has breached the first support level. The next key support lies at the $100 level, a critical psychological and technical threshold that has held for over two and a half years.
While this level is likely to provide near-term support, macro concerns about persistent inflation remain unresolved. Traders should closely monitor price action around this pivotal zone.
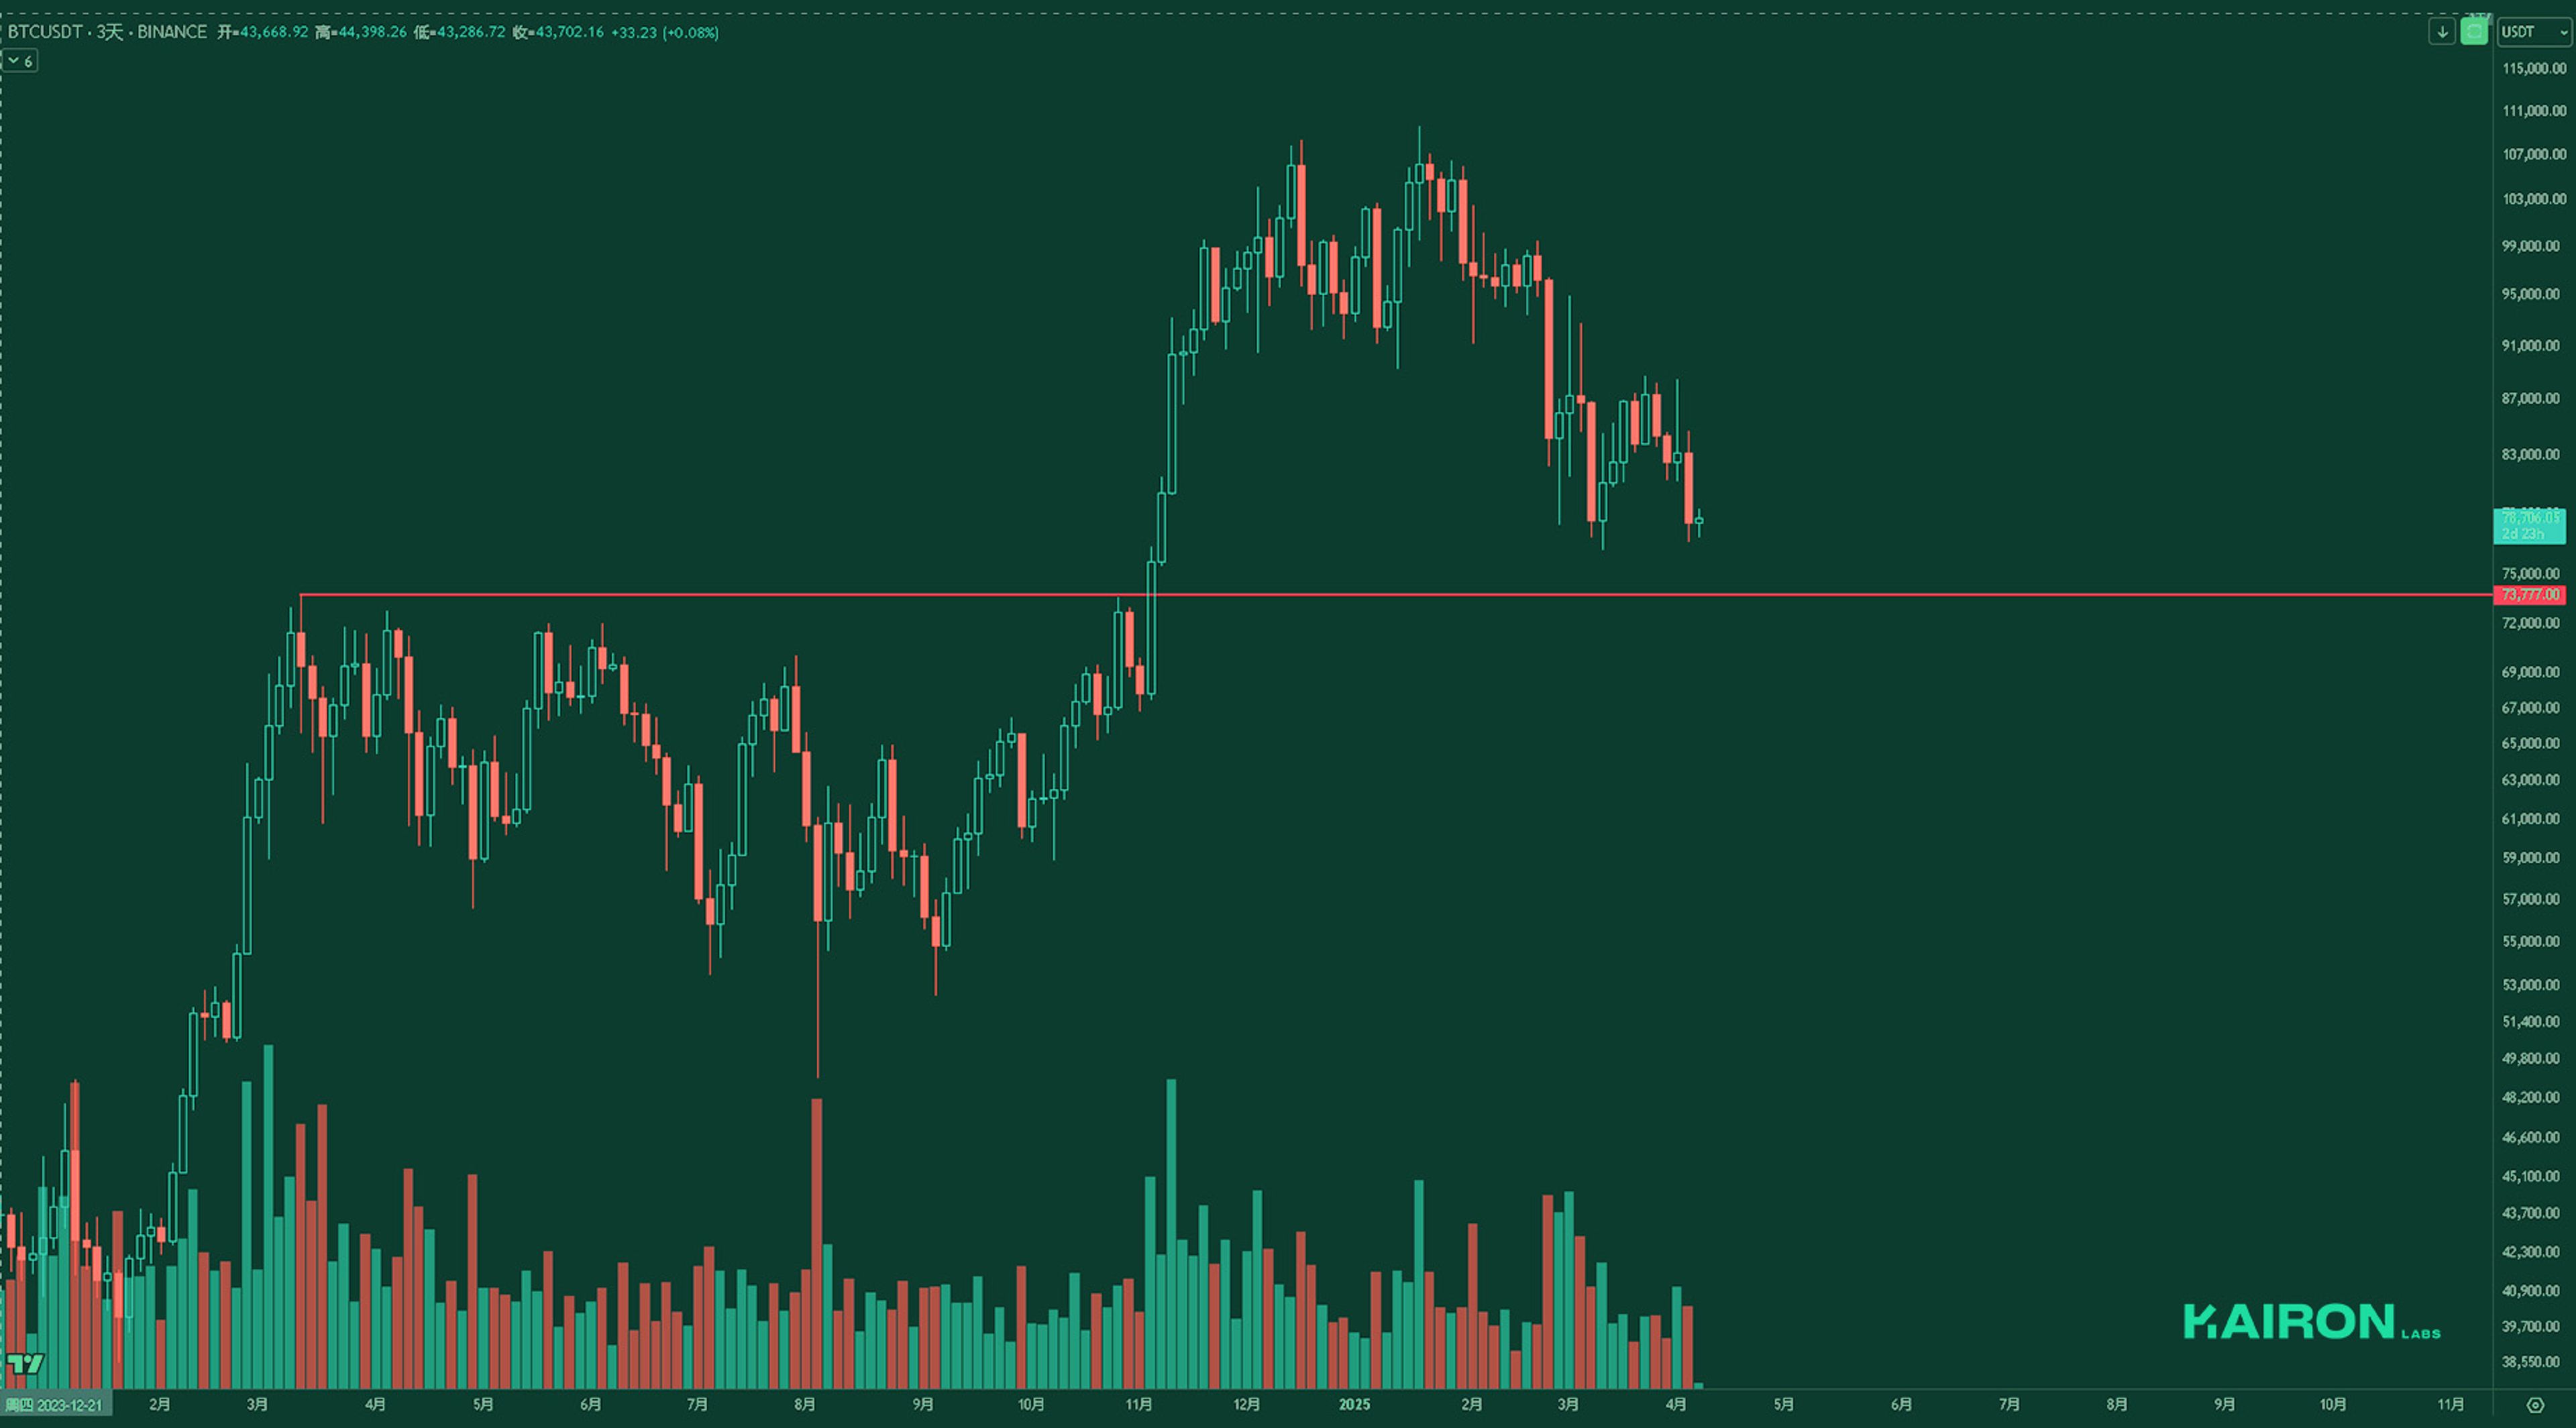
BTC’s price action has unfolded as cautioned last week, with BTC retesting its previous swing low. While BTC has shown relative resilience compared to equities, the risk of a catch-down move remains if this support fails. A breakdown here would shift focus to the $73k zone as the next critical area for buyer conviction.
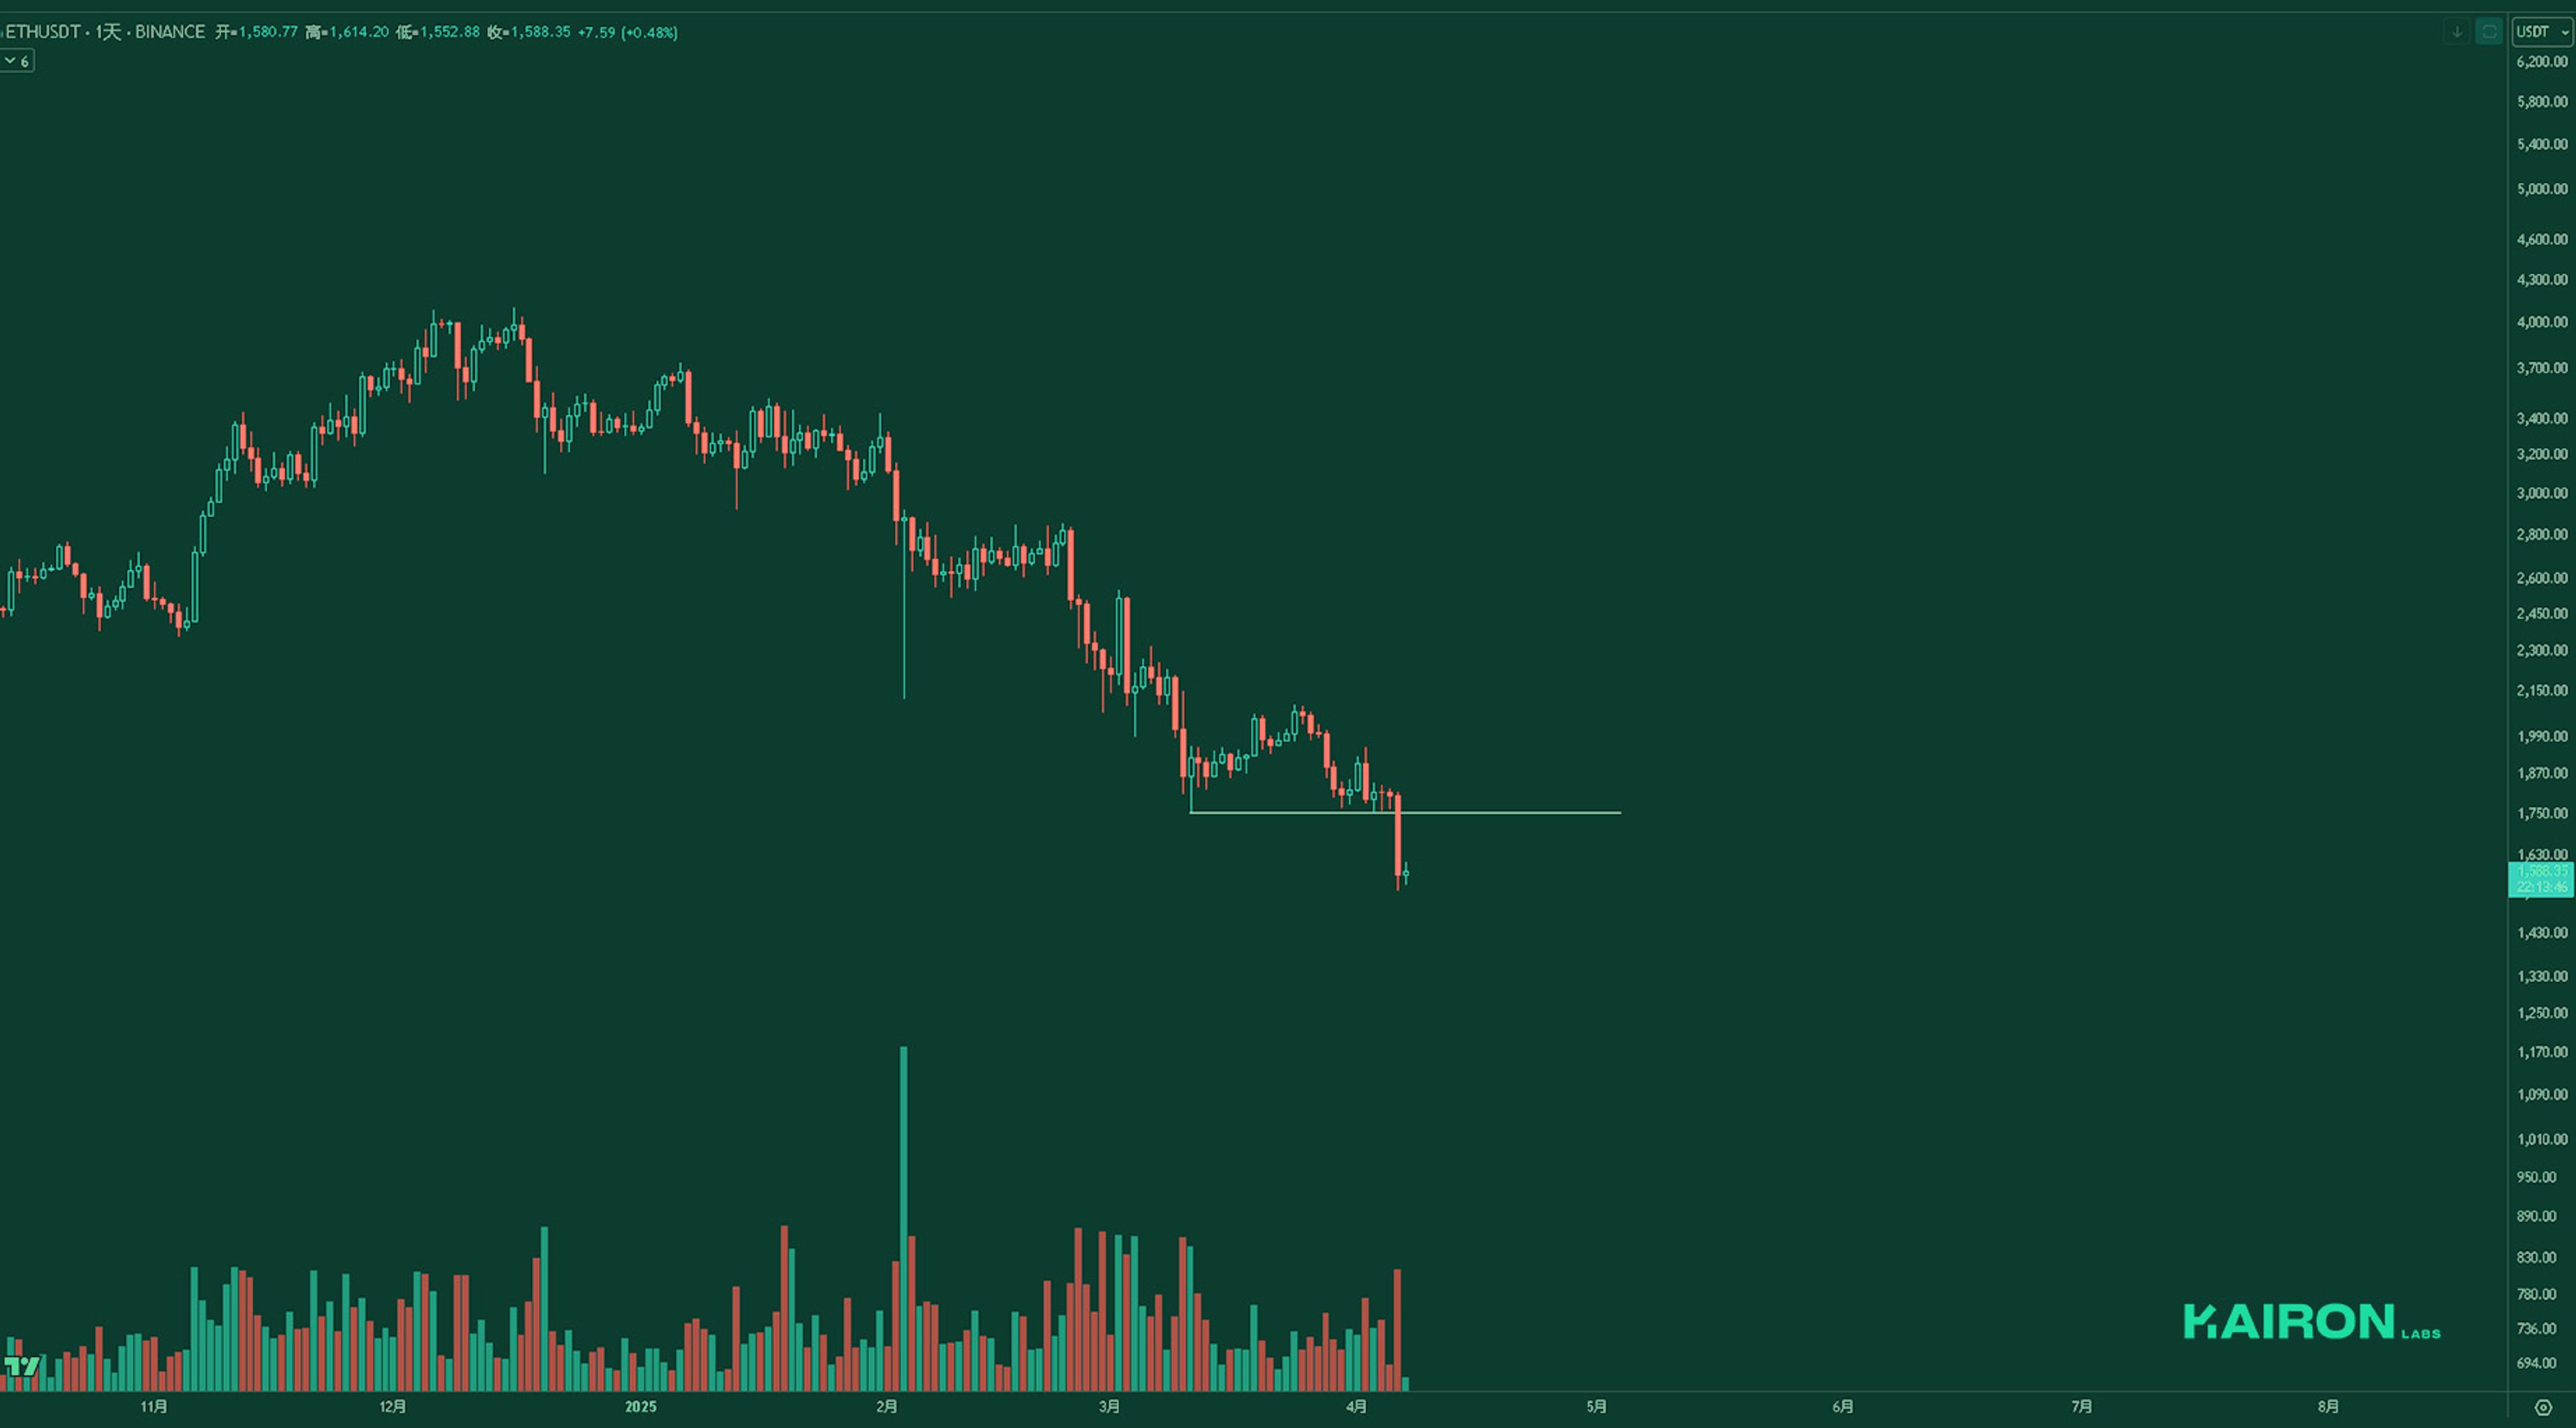
ETH has decisively breached the critical $1,750 support on heavy volume, plunging 12.5%, back to 2023 lows. The price remains firmly in a downtrend with no reversal signals yet disregard RSI oversold.
Clearly, as BTC declined by 6%, ETH saw a sharper drop of 15%, with no bullish signals for ETH.
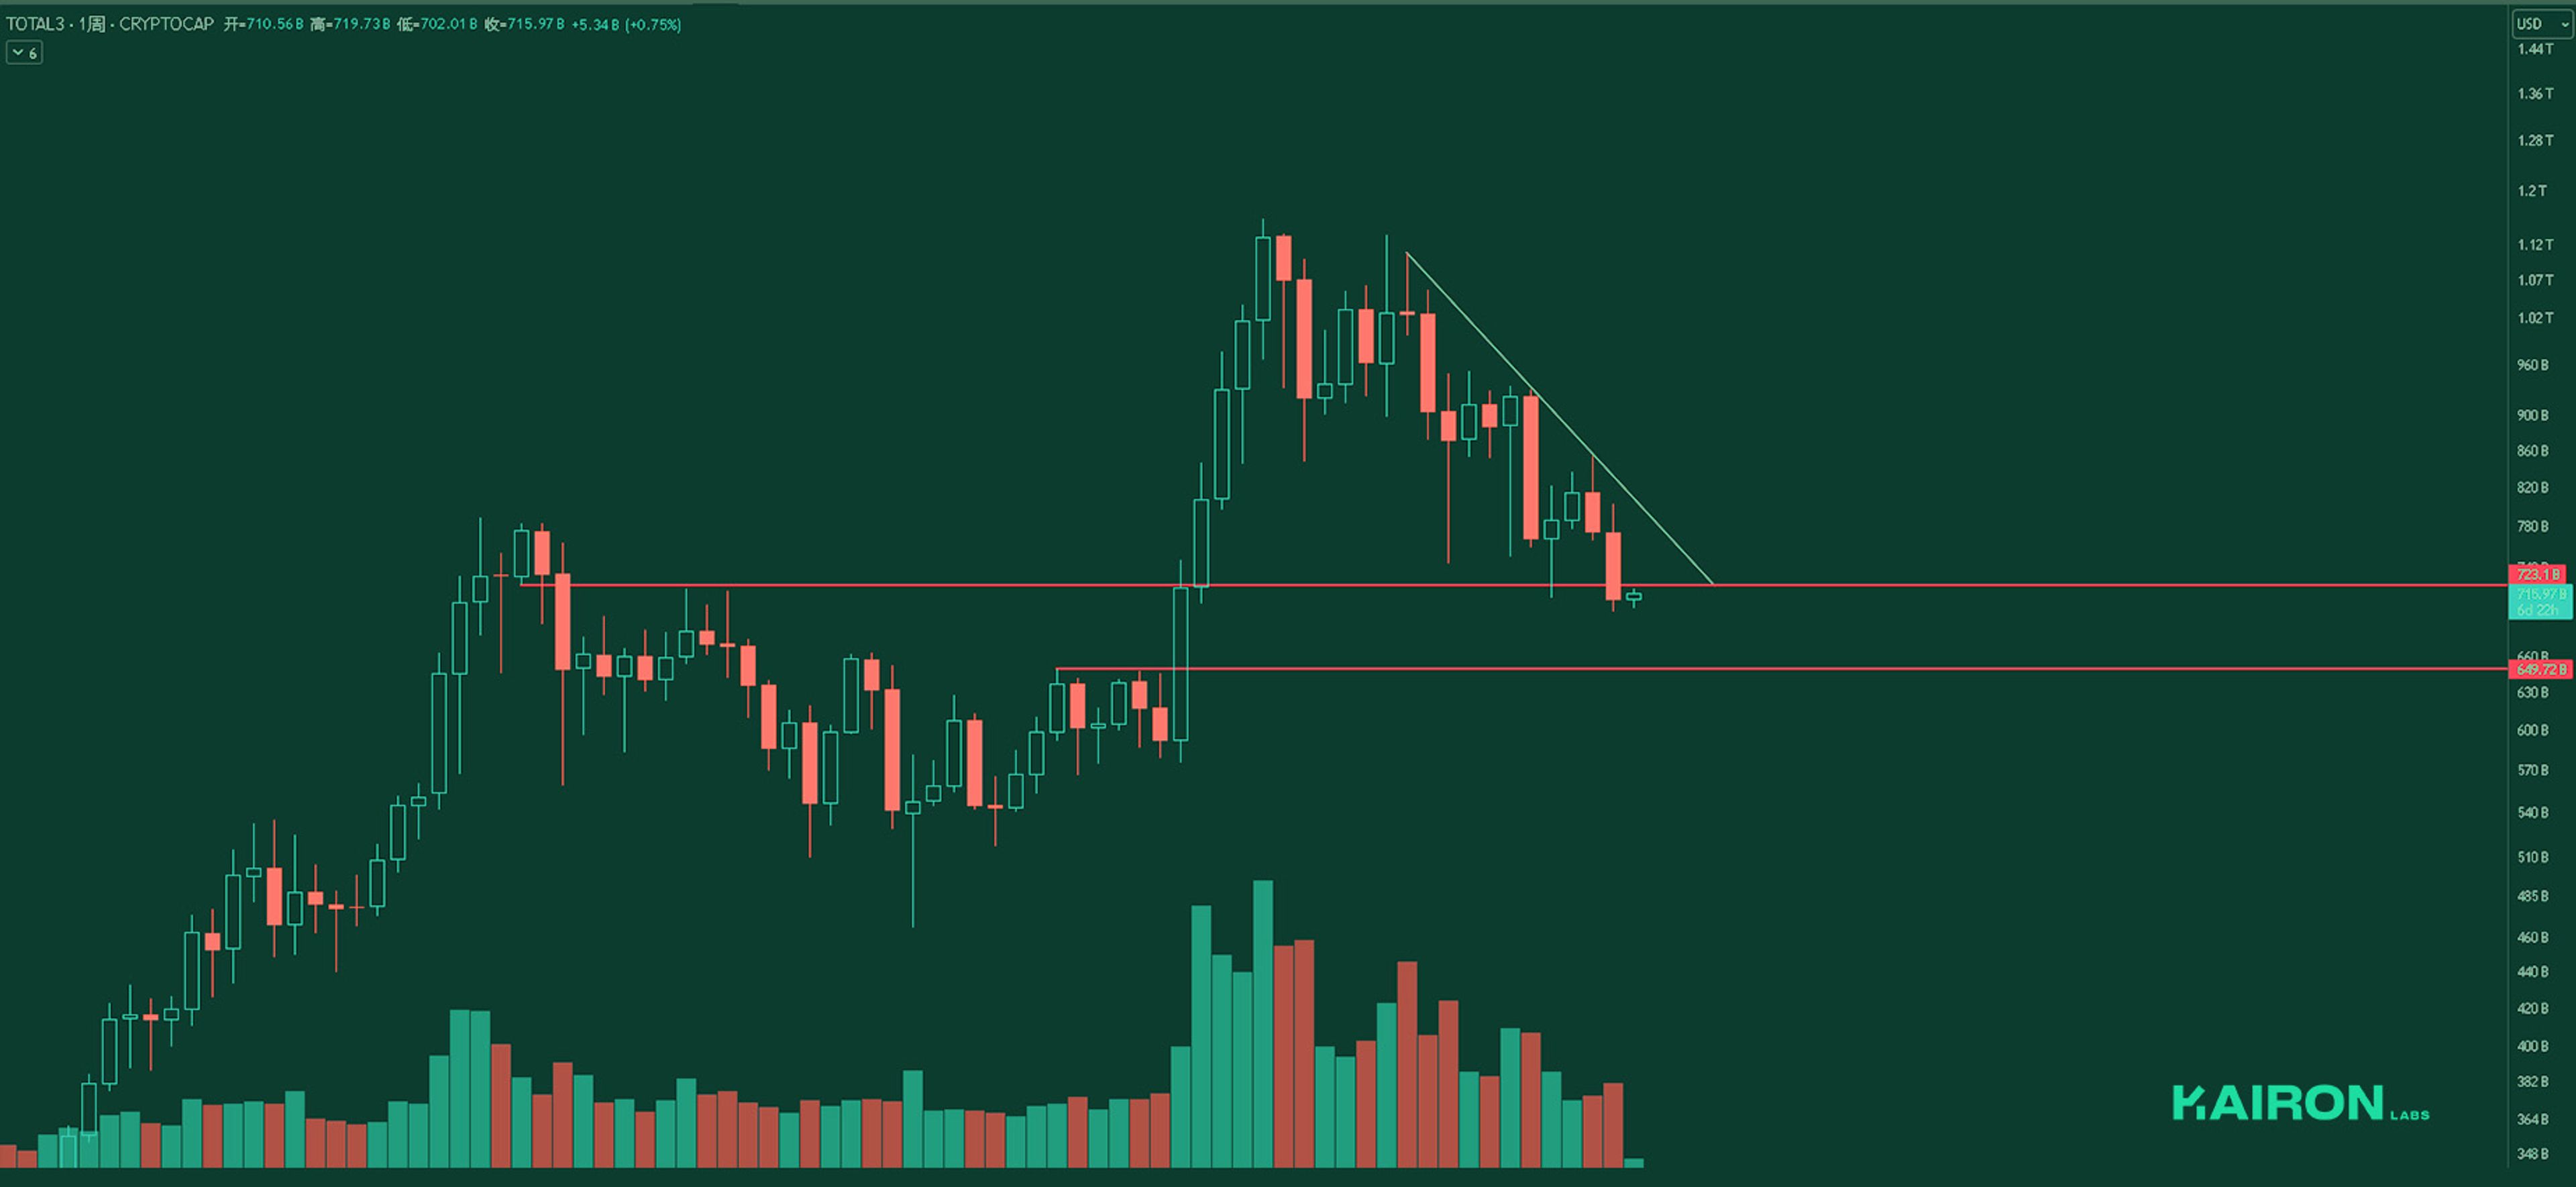
In line with our projections from last week, TOTAL3 has extended its downtrend, reaching the 723.1 B – 723.1B–650B demand zone. Historically, this region hasn’t provided reliable support, but we may start seeing early accumulation from buyers in this range.
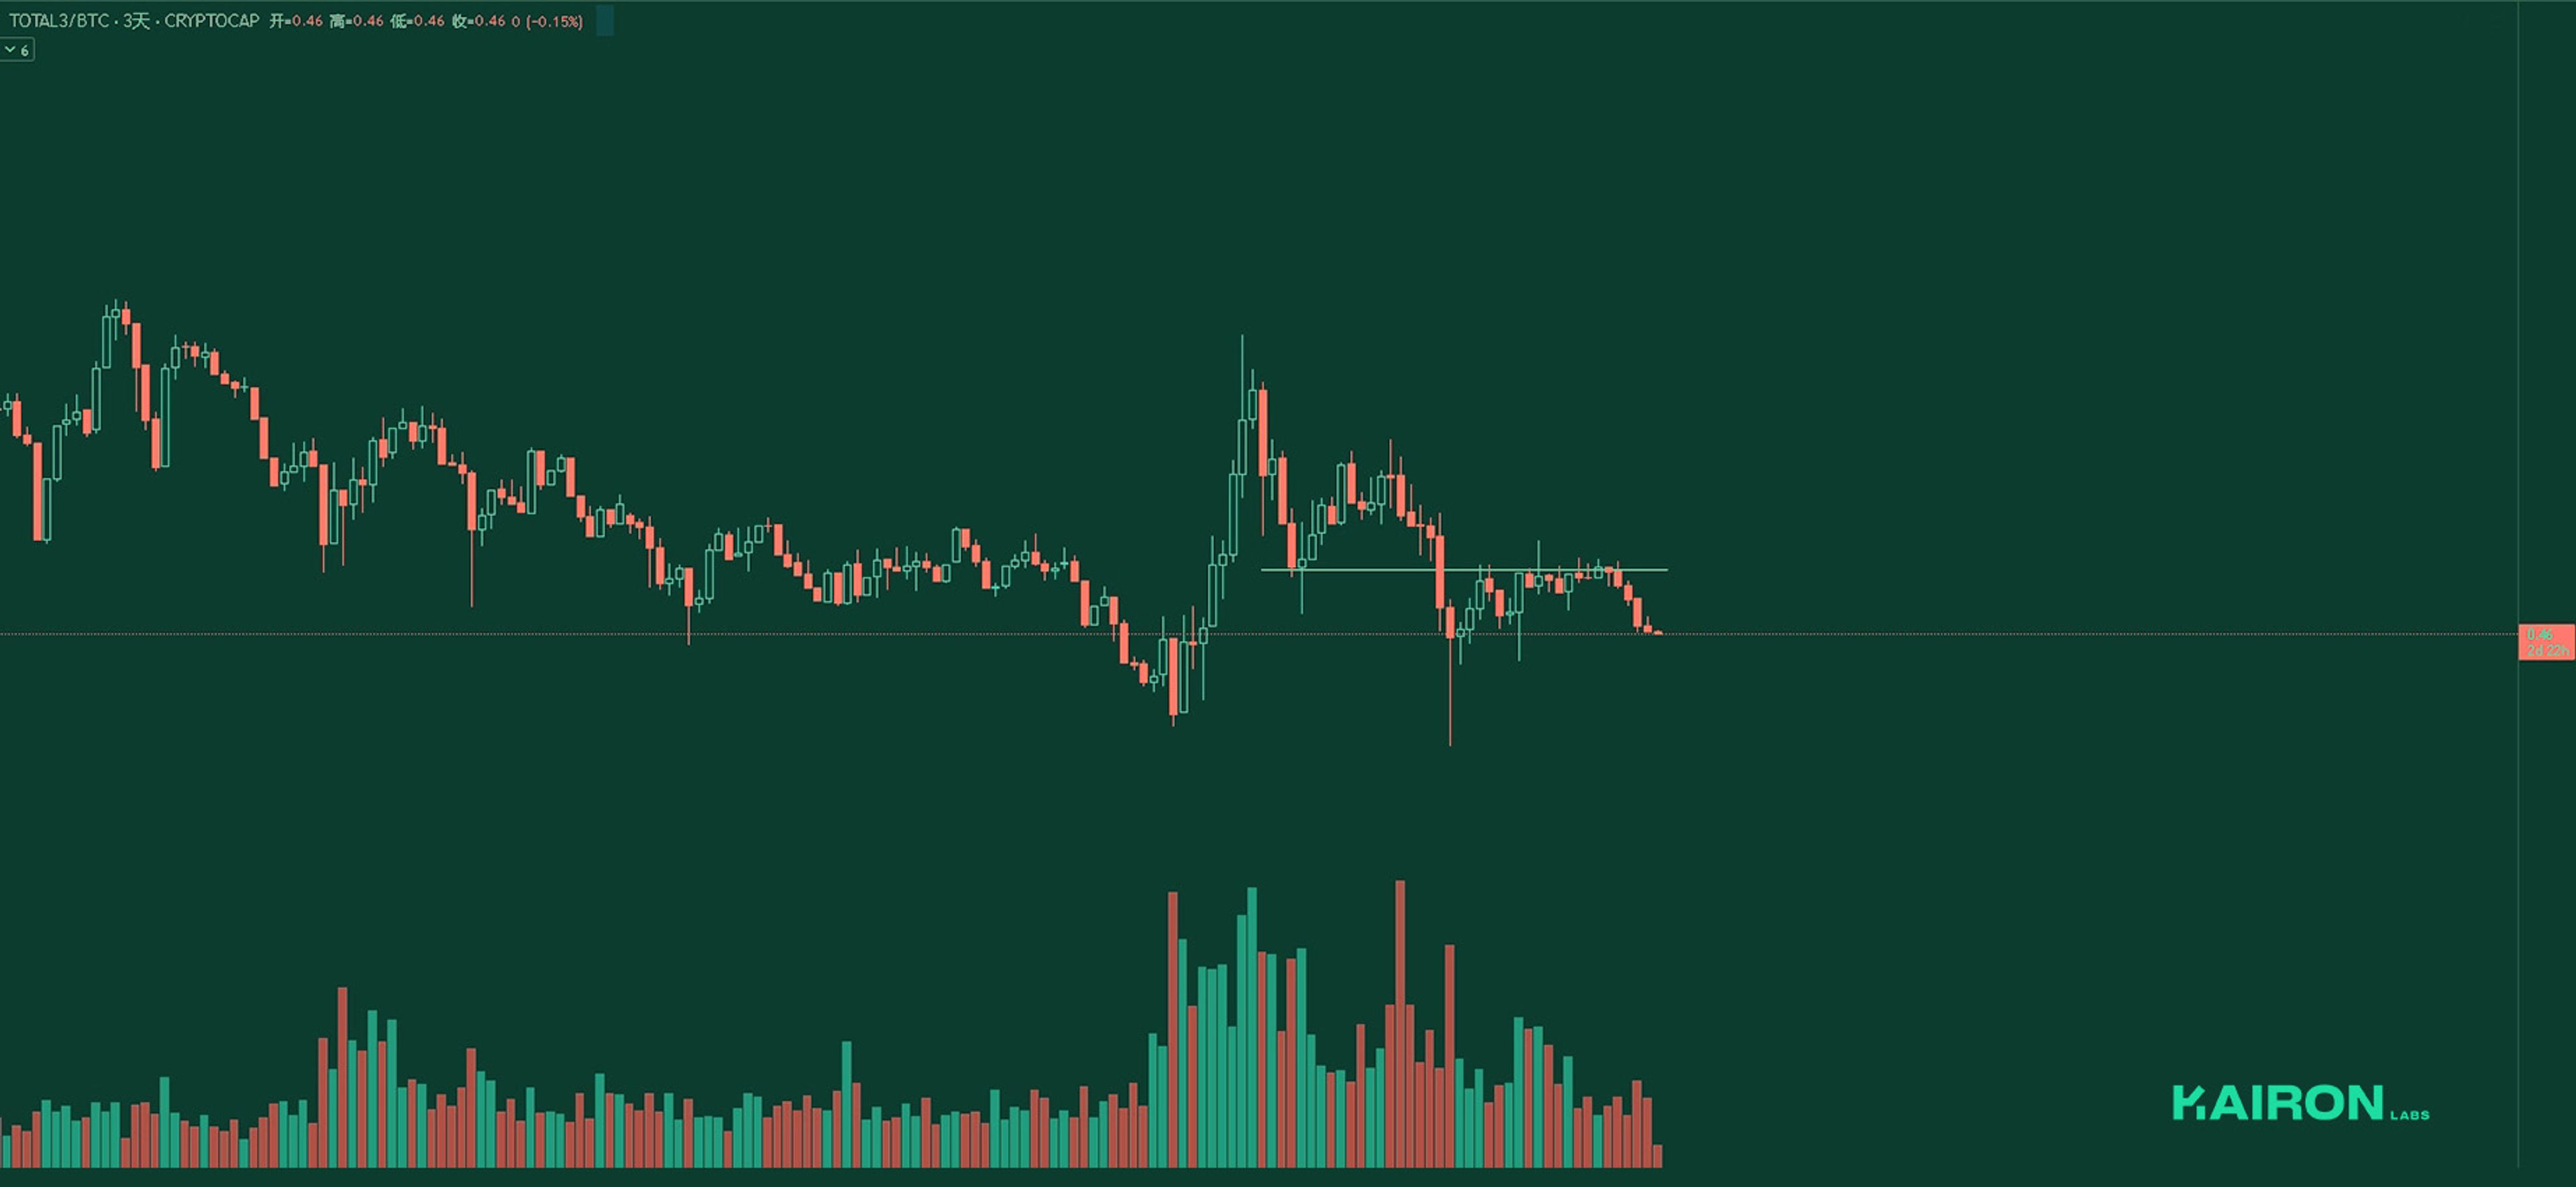
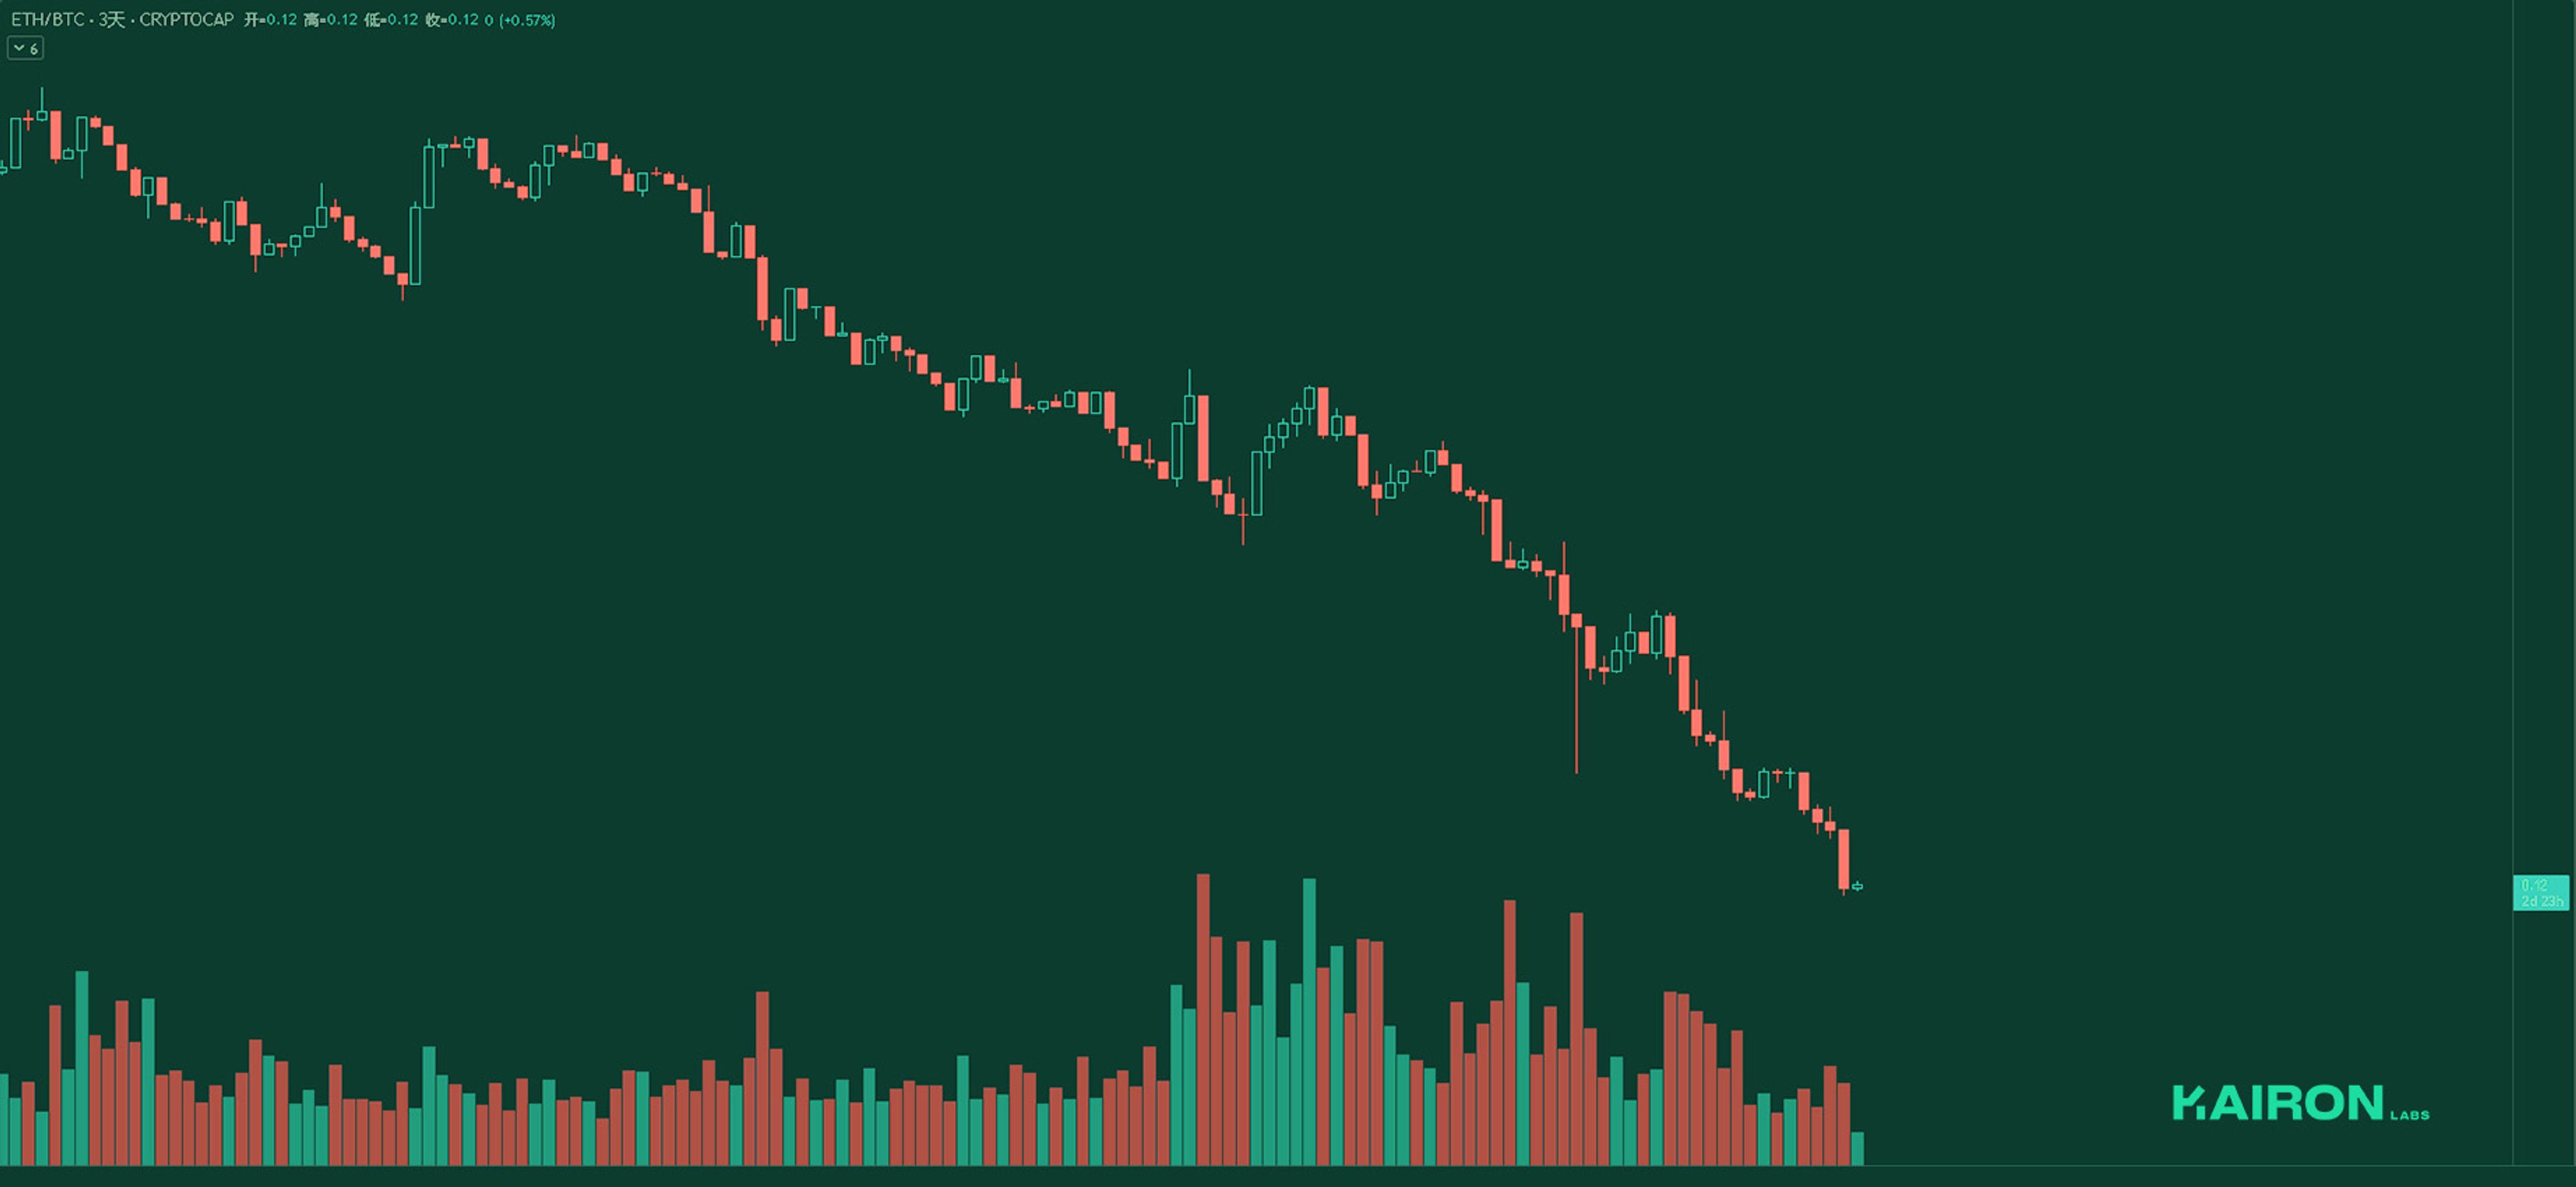
Total3/BTC‘s price action suggests that bullish efforts remain unconvincing, with TOTAL3 still lagging behind BTC and displaying no meaningful strength. The lack of follow-through reinforces the current bearish bias.
Leverage is getting flushed out of the system - traders are backing off as the market shows no signs of stabilizing, creating a negative feedback loop of lower liquidity and weaker price action.
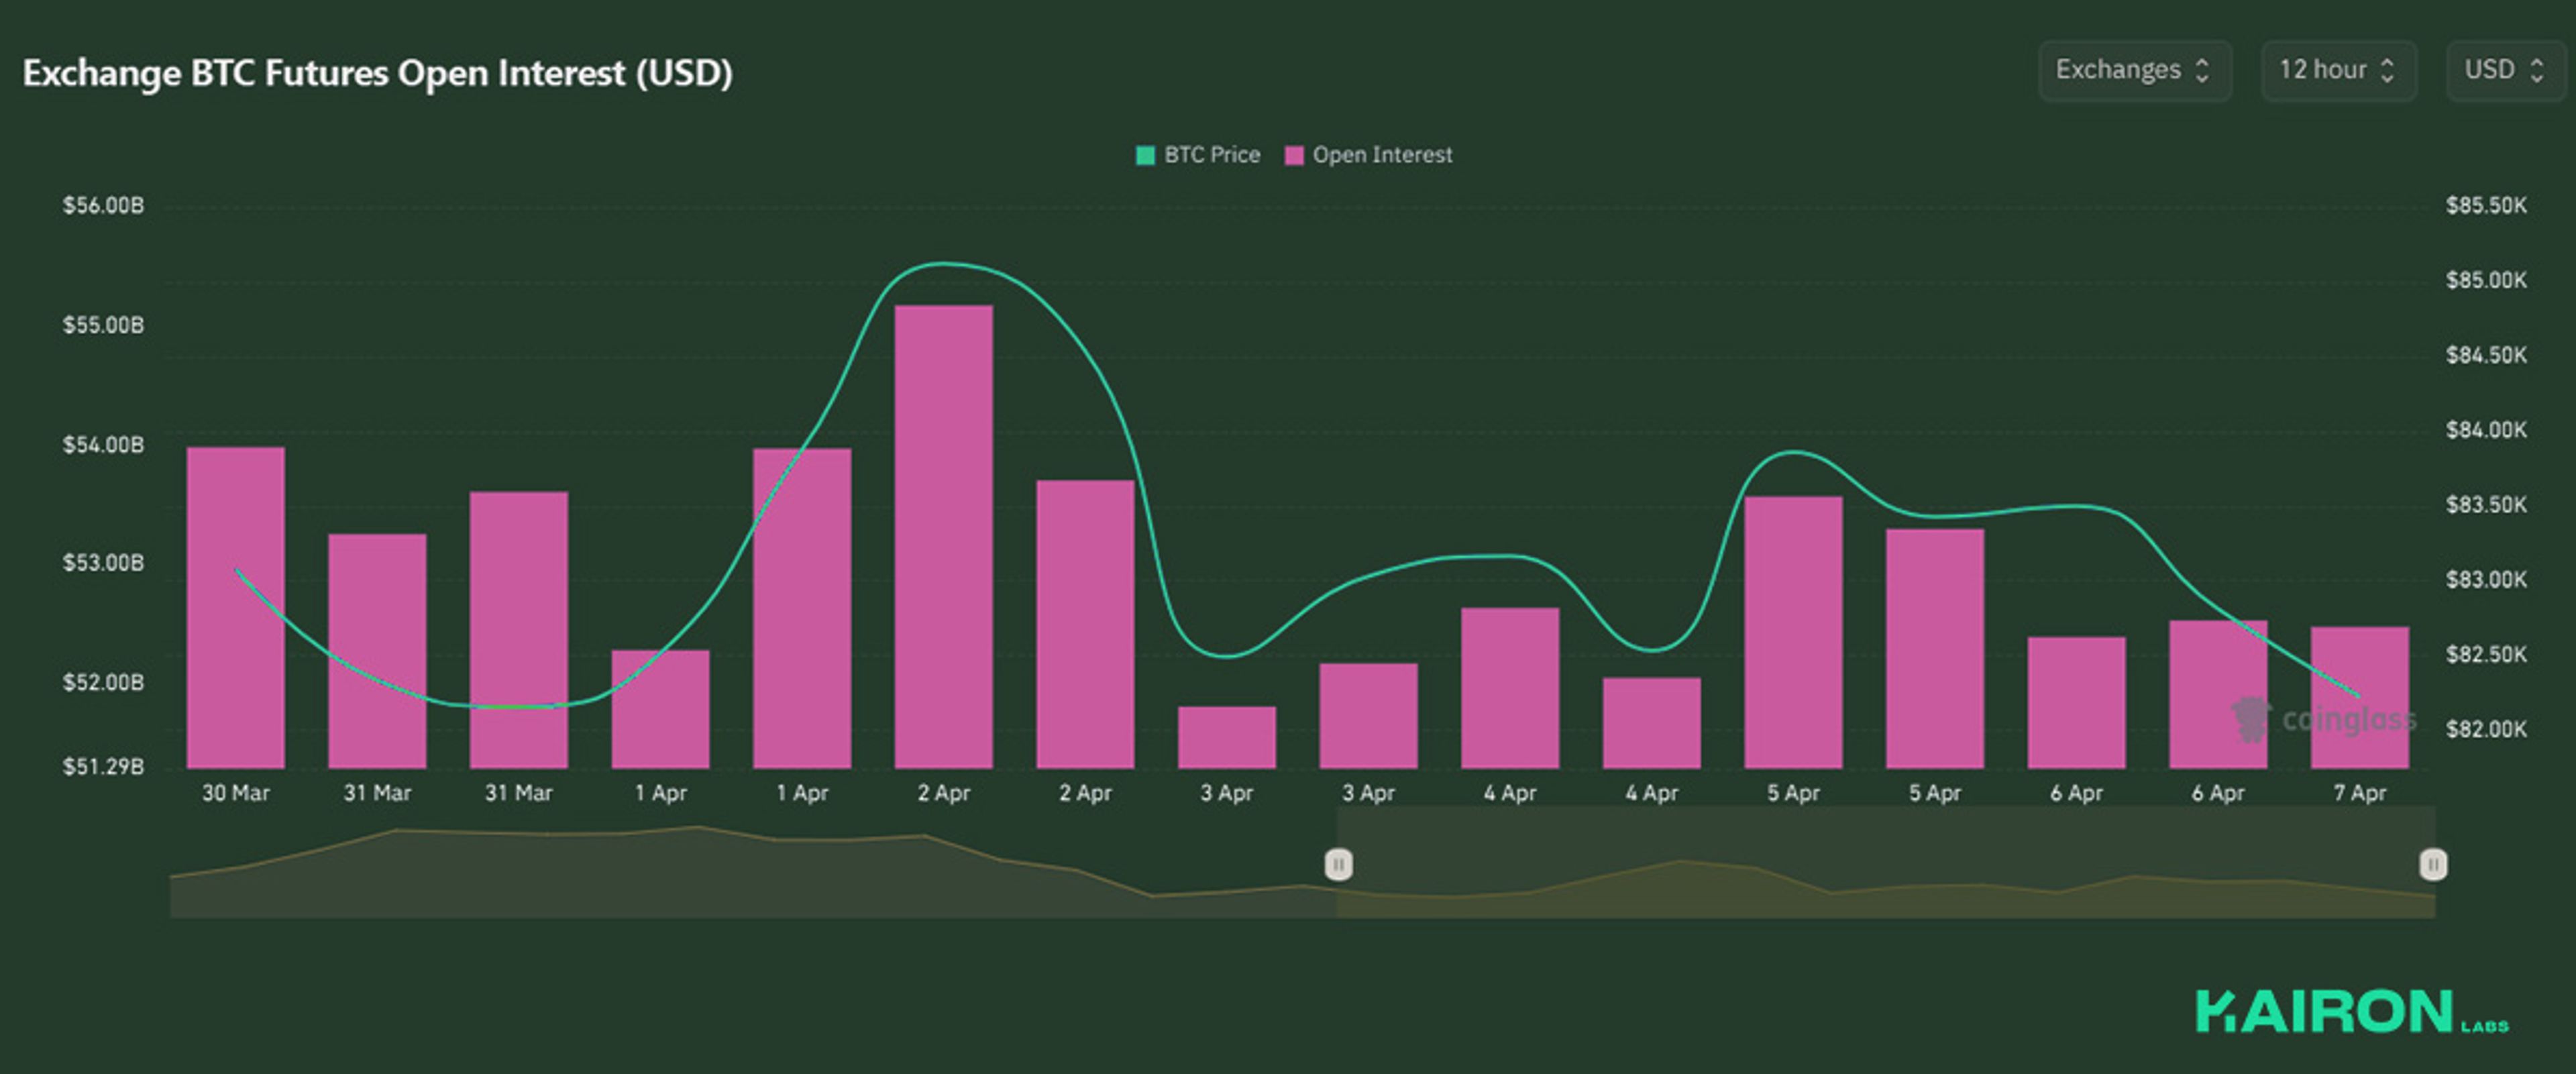
There was a spike in Open Interest on 2nd April - Liberation Day, as traders either opened new positions for speculative or hedging purposes for the big risk event.
However, OI fell sharply with BTC as the risk-off move ensued following the bearish event, as traders exited positions.
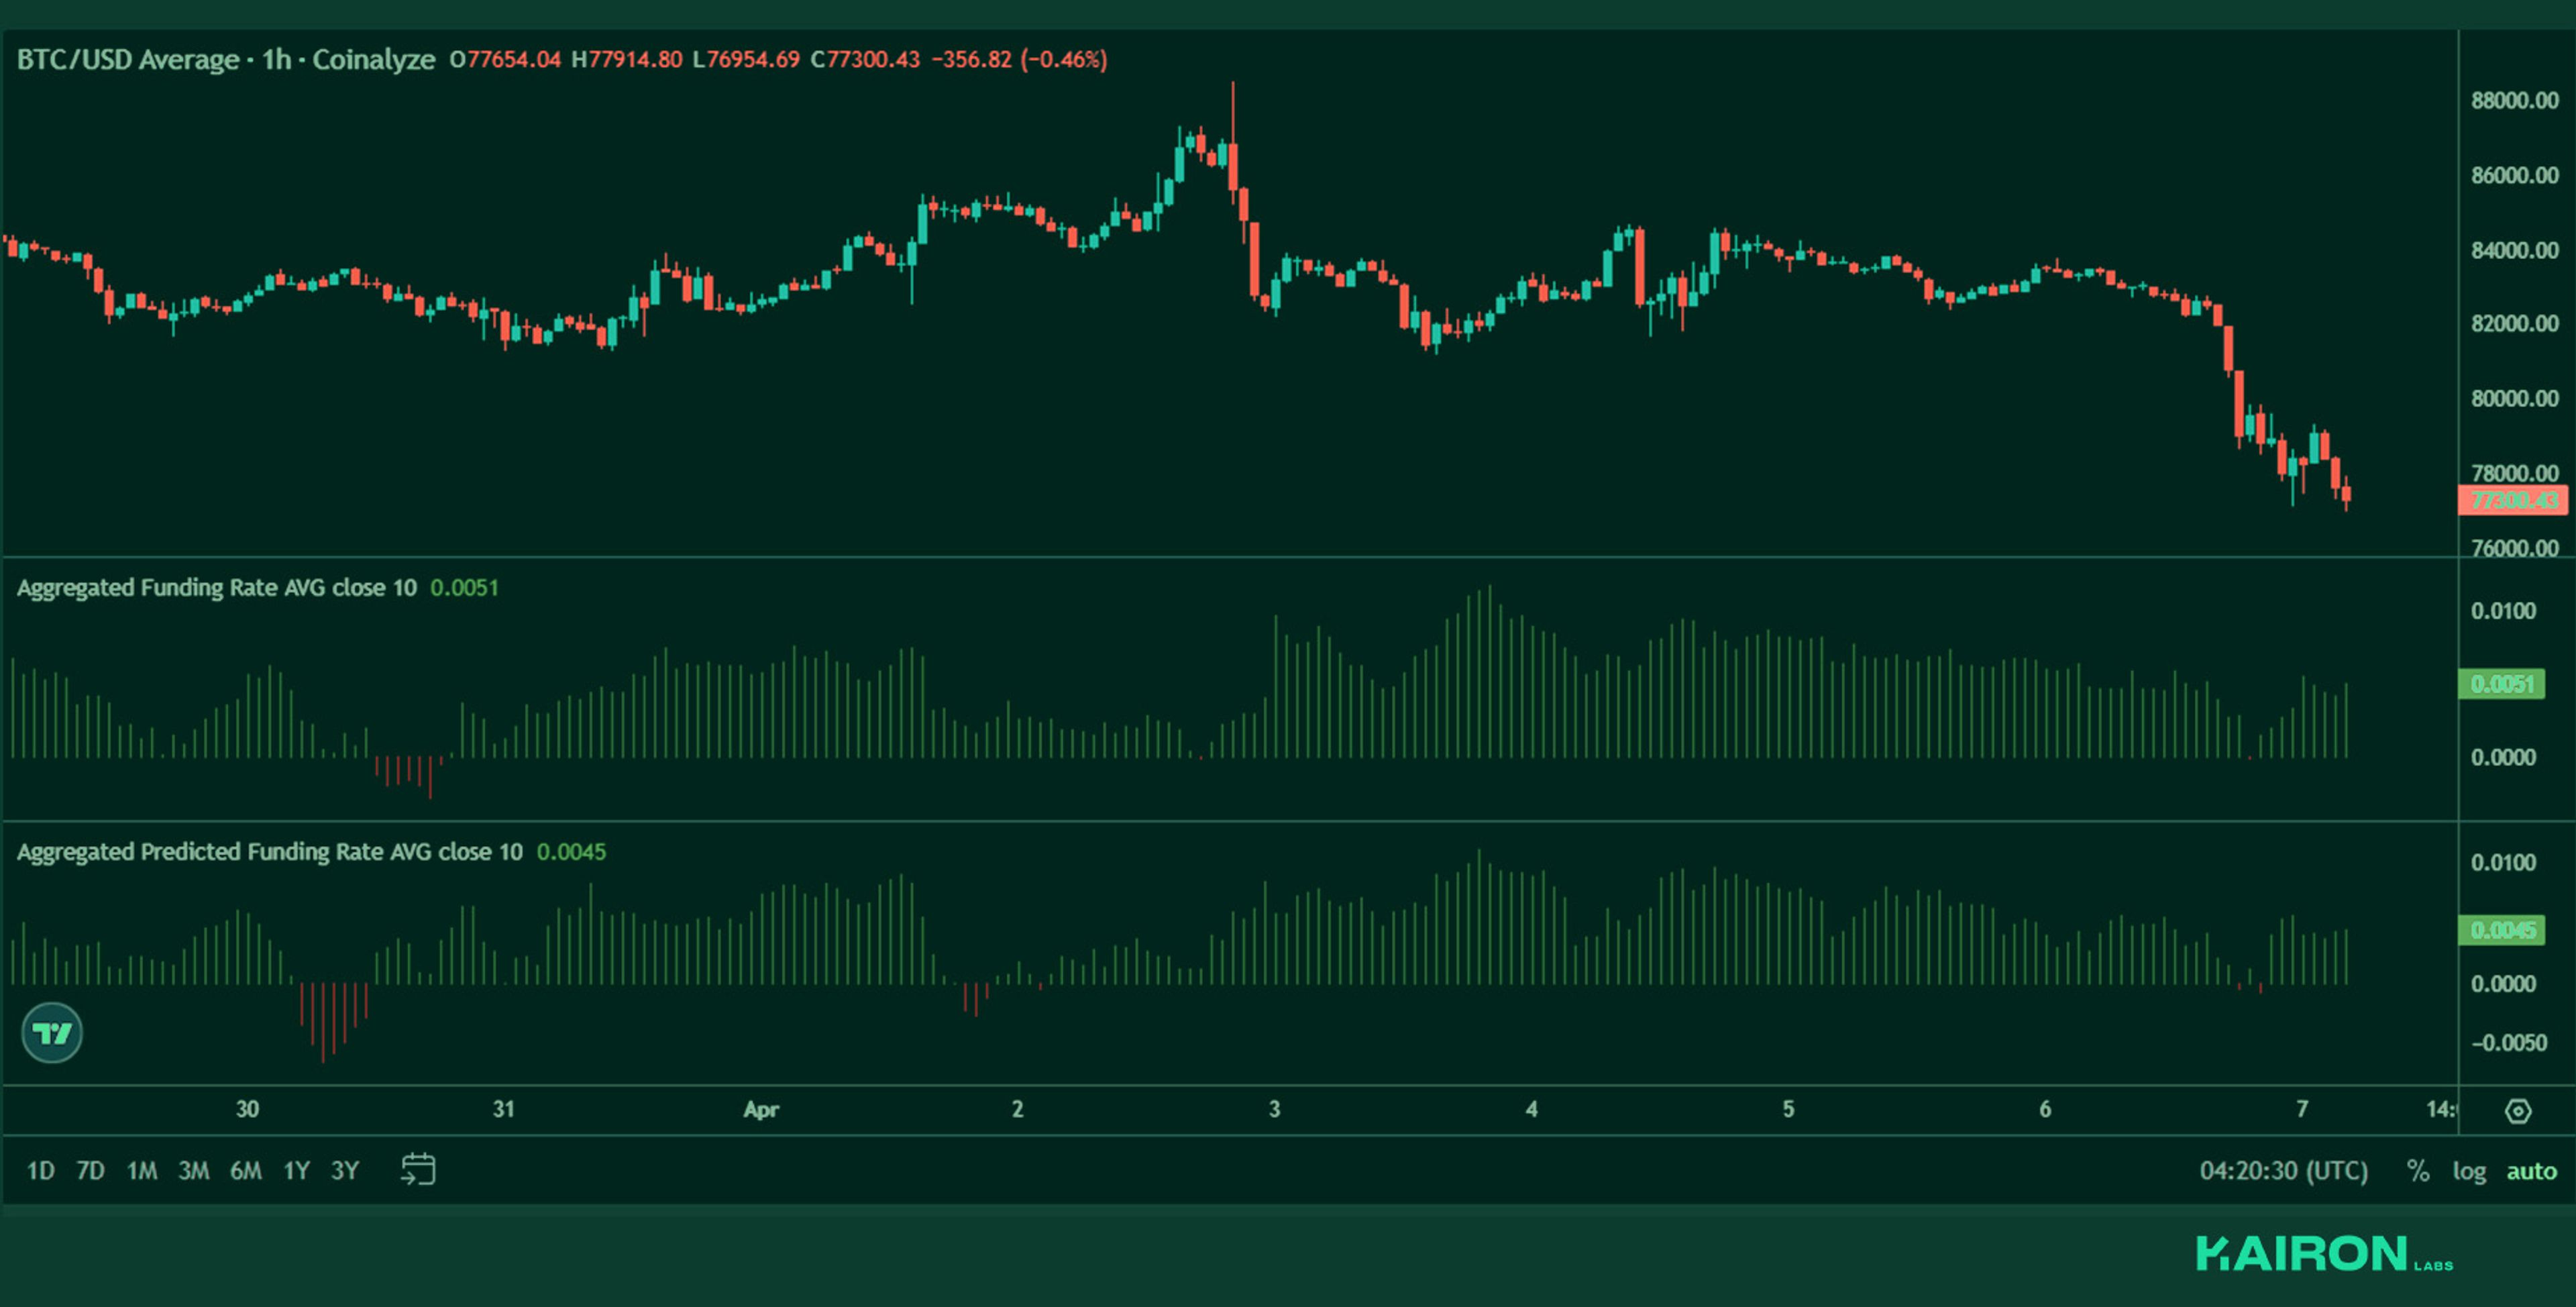
BTC perps funding consolidated towards 0 as BTC climbed towards the high of April 2nd- a sign that perps positions were leaning towards shorts towards the highs.
Following the drop in BTC after the April 2nd risk event, OI started to climb up again- possibly from bears exiting their shorts and long positions starting to build again.
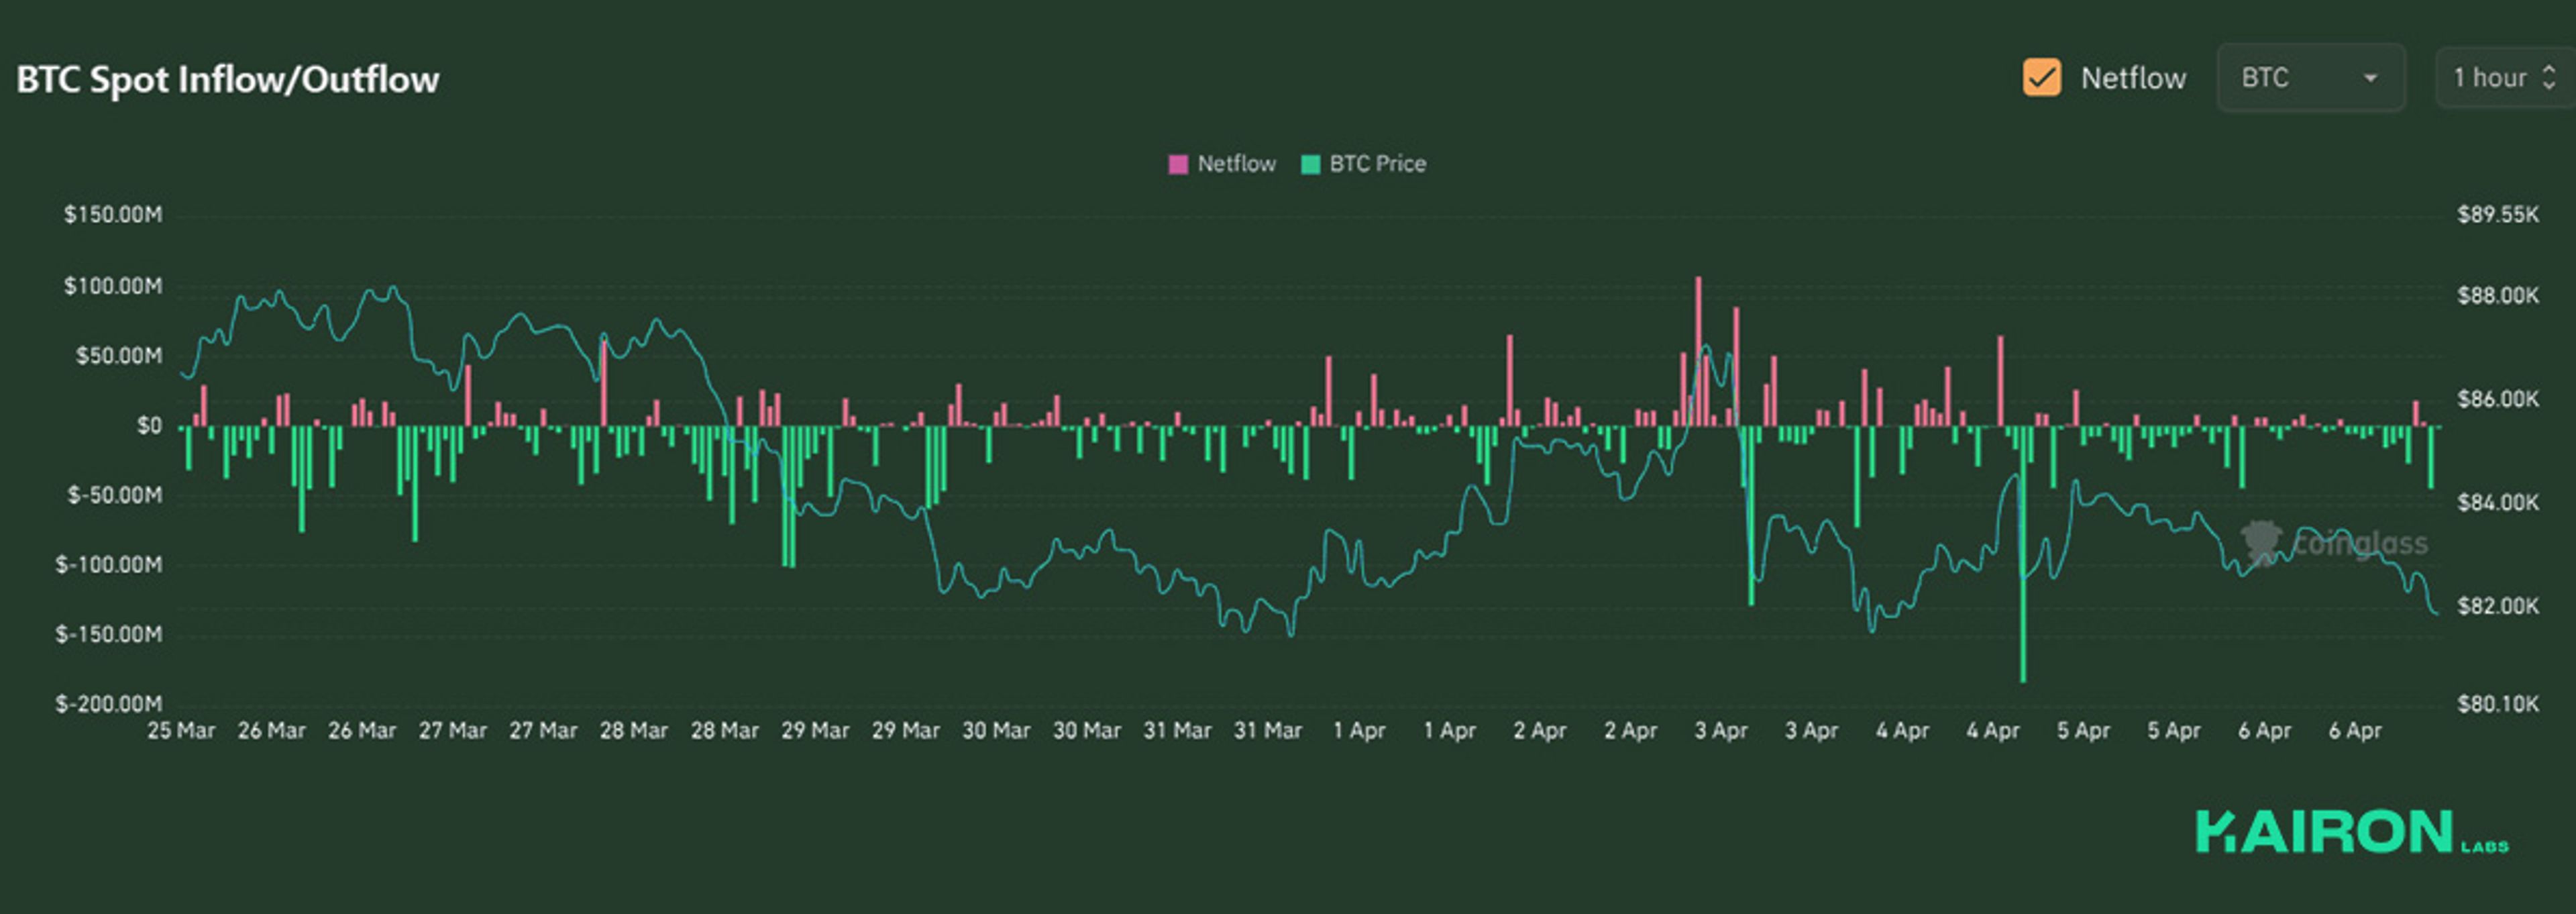
BTC Spot saw net inflows with the surge in price on 2nd April, before net outflows after the tariff escalation led to the retracement in prices
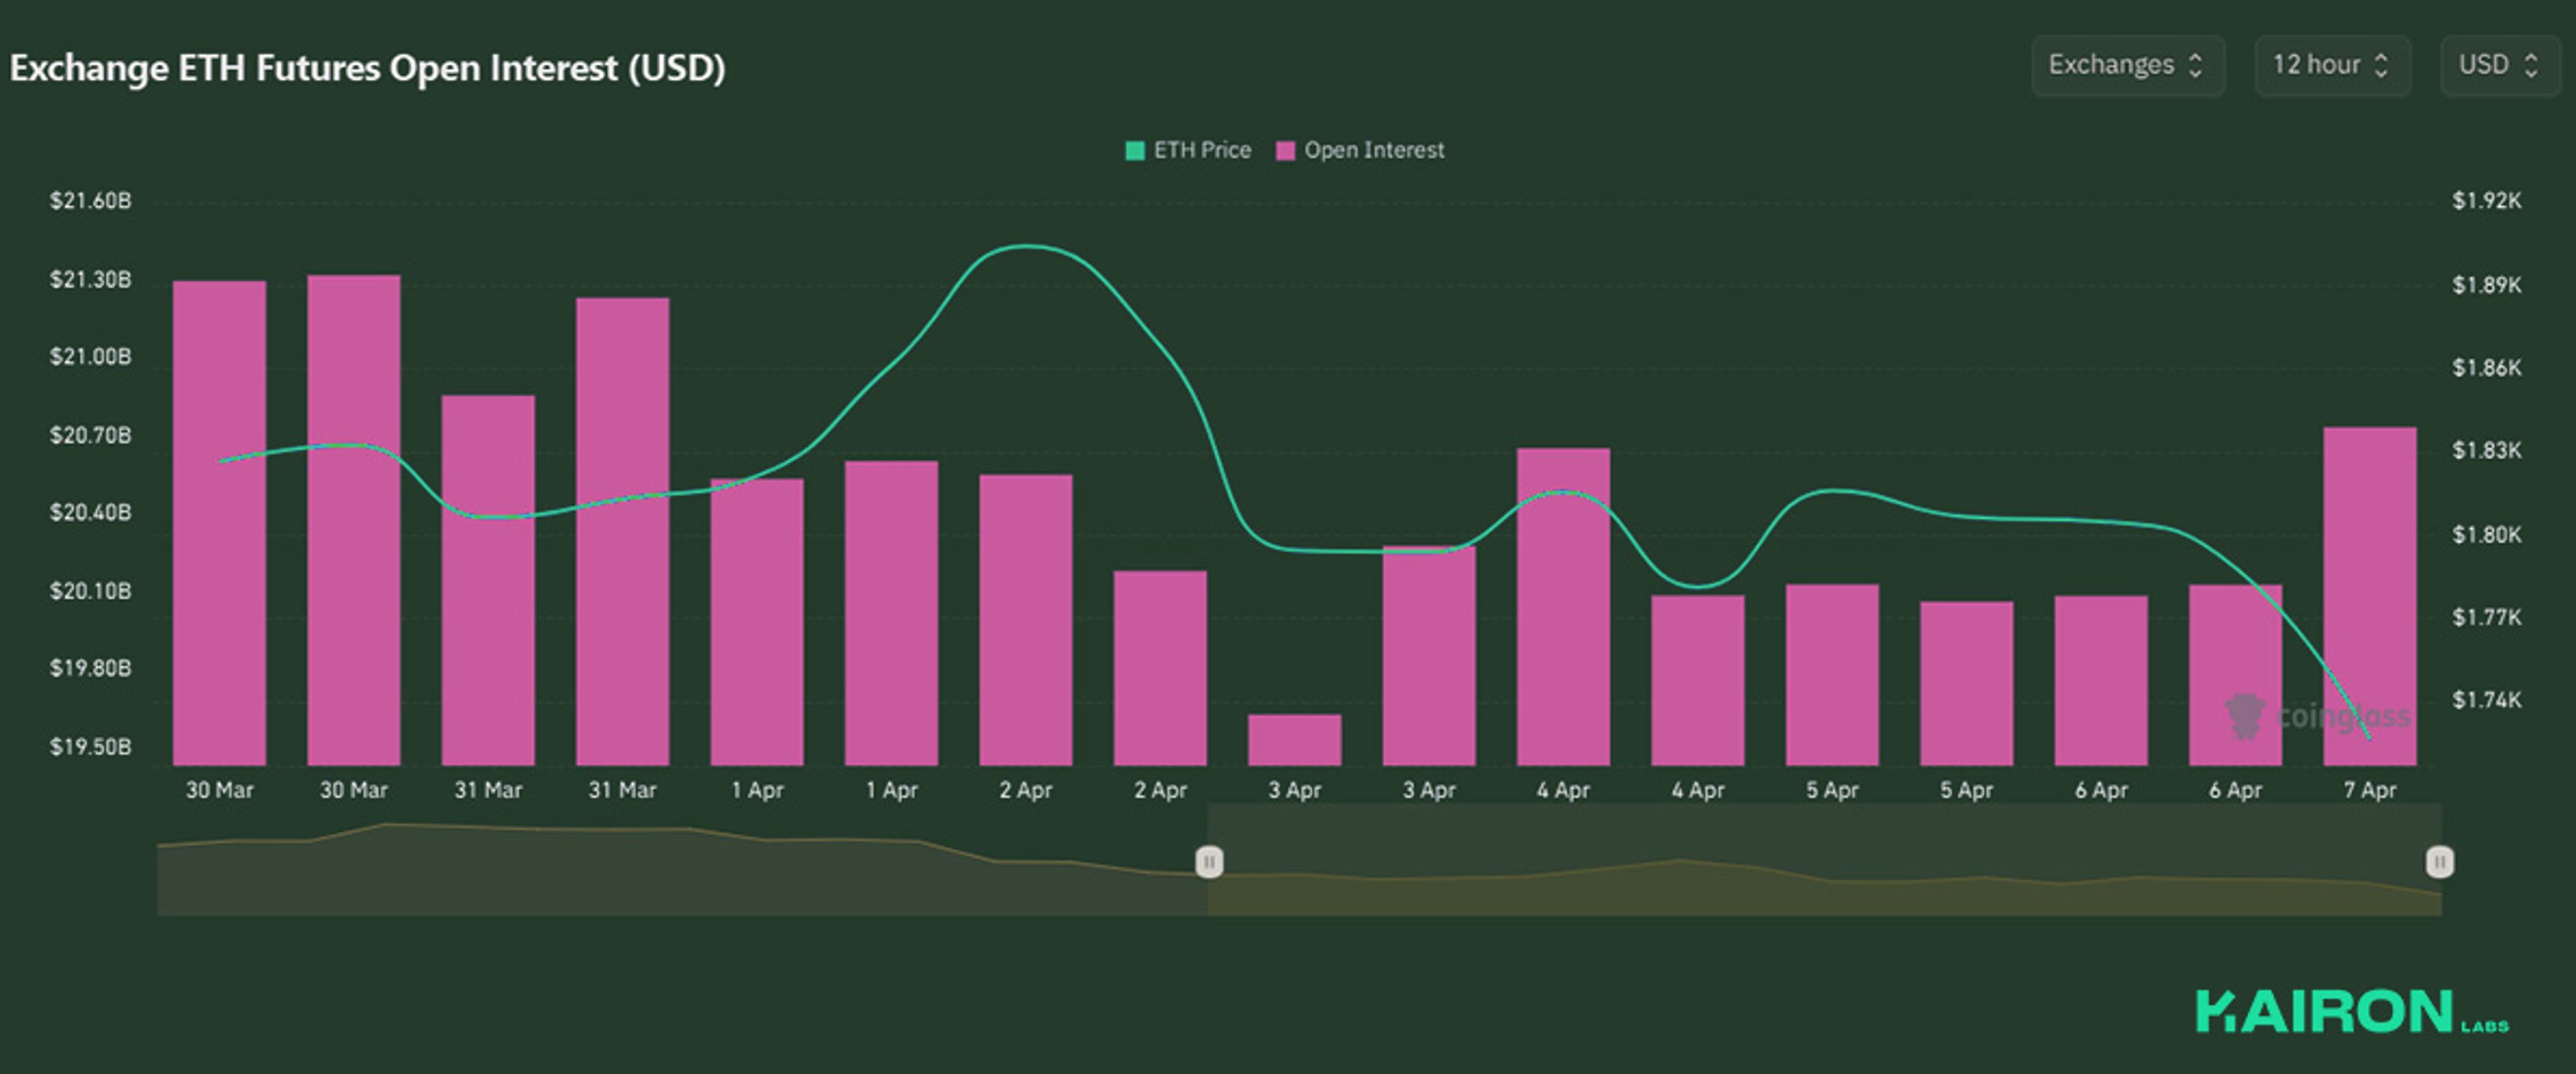
Similarly, OI decreased significantly with the drop in ETH price following April 2nd’s tariff announcements, as traders exited positions.
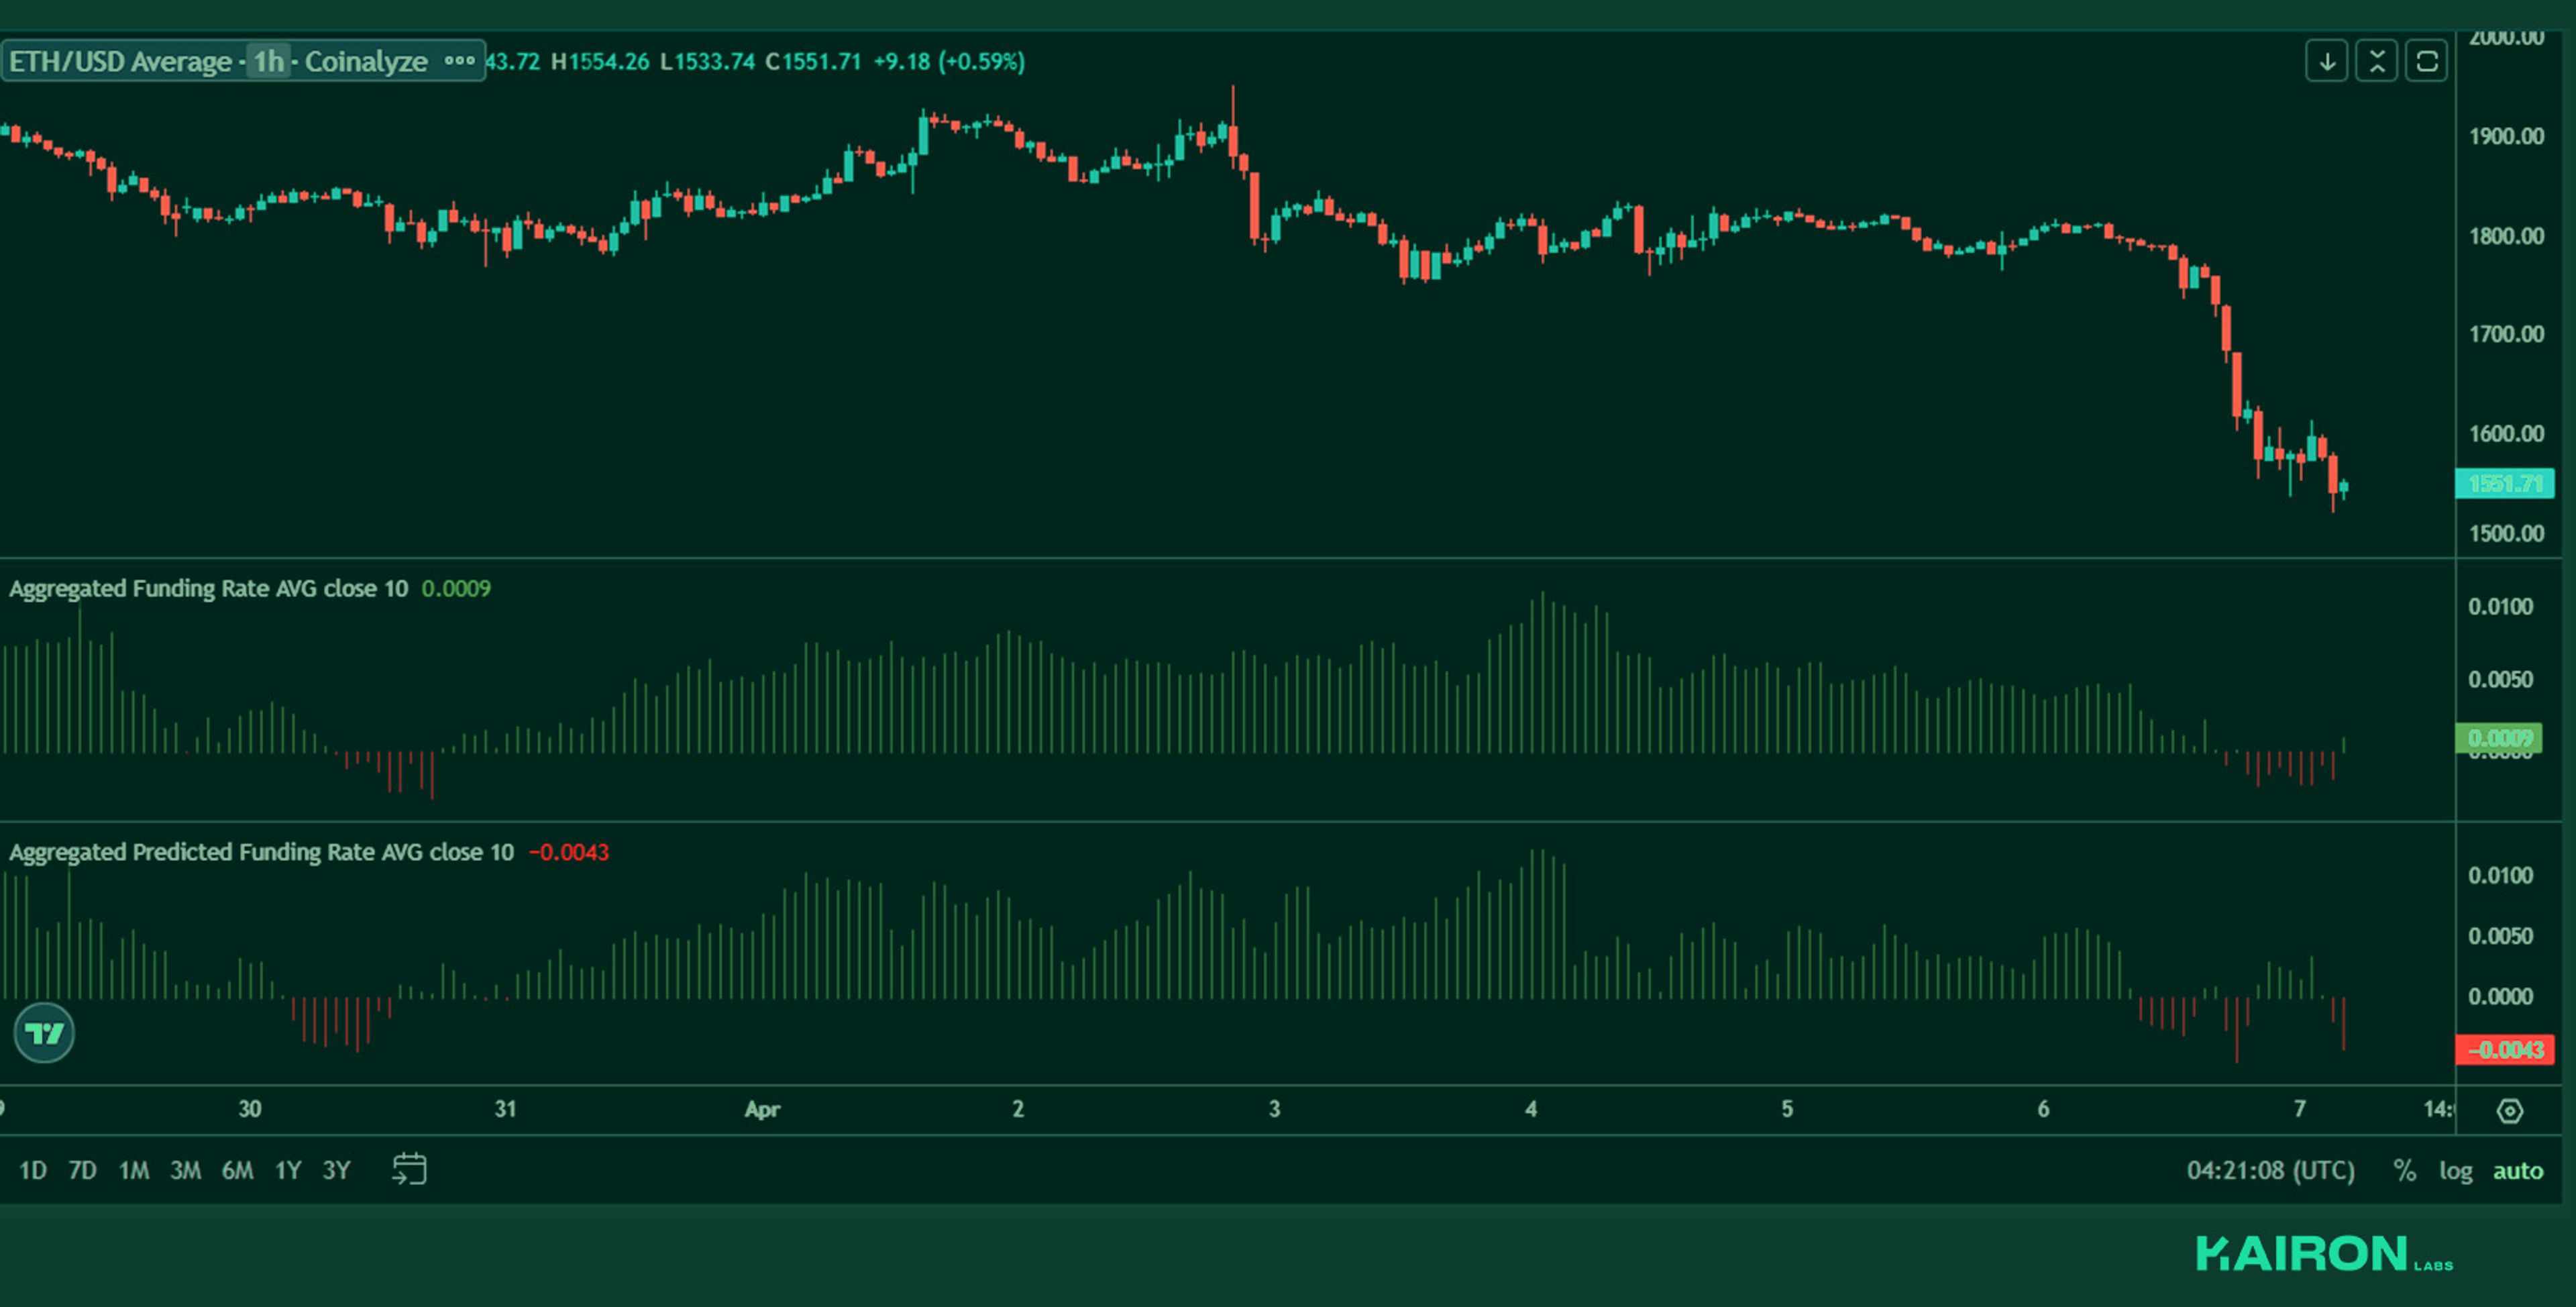
ETH funding built up towards the 2nd April risk event; however, in the ensuing fall in price, there was no significant fall in funding as funding stayed positive, a sign that the market remained long.
This would likely point to further downside, which indeed happened towards the weekend, when ETH broke below the range and hit 1551, with funding falling together and going negative.
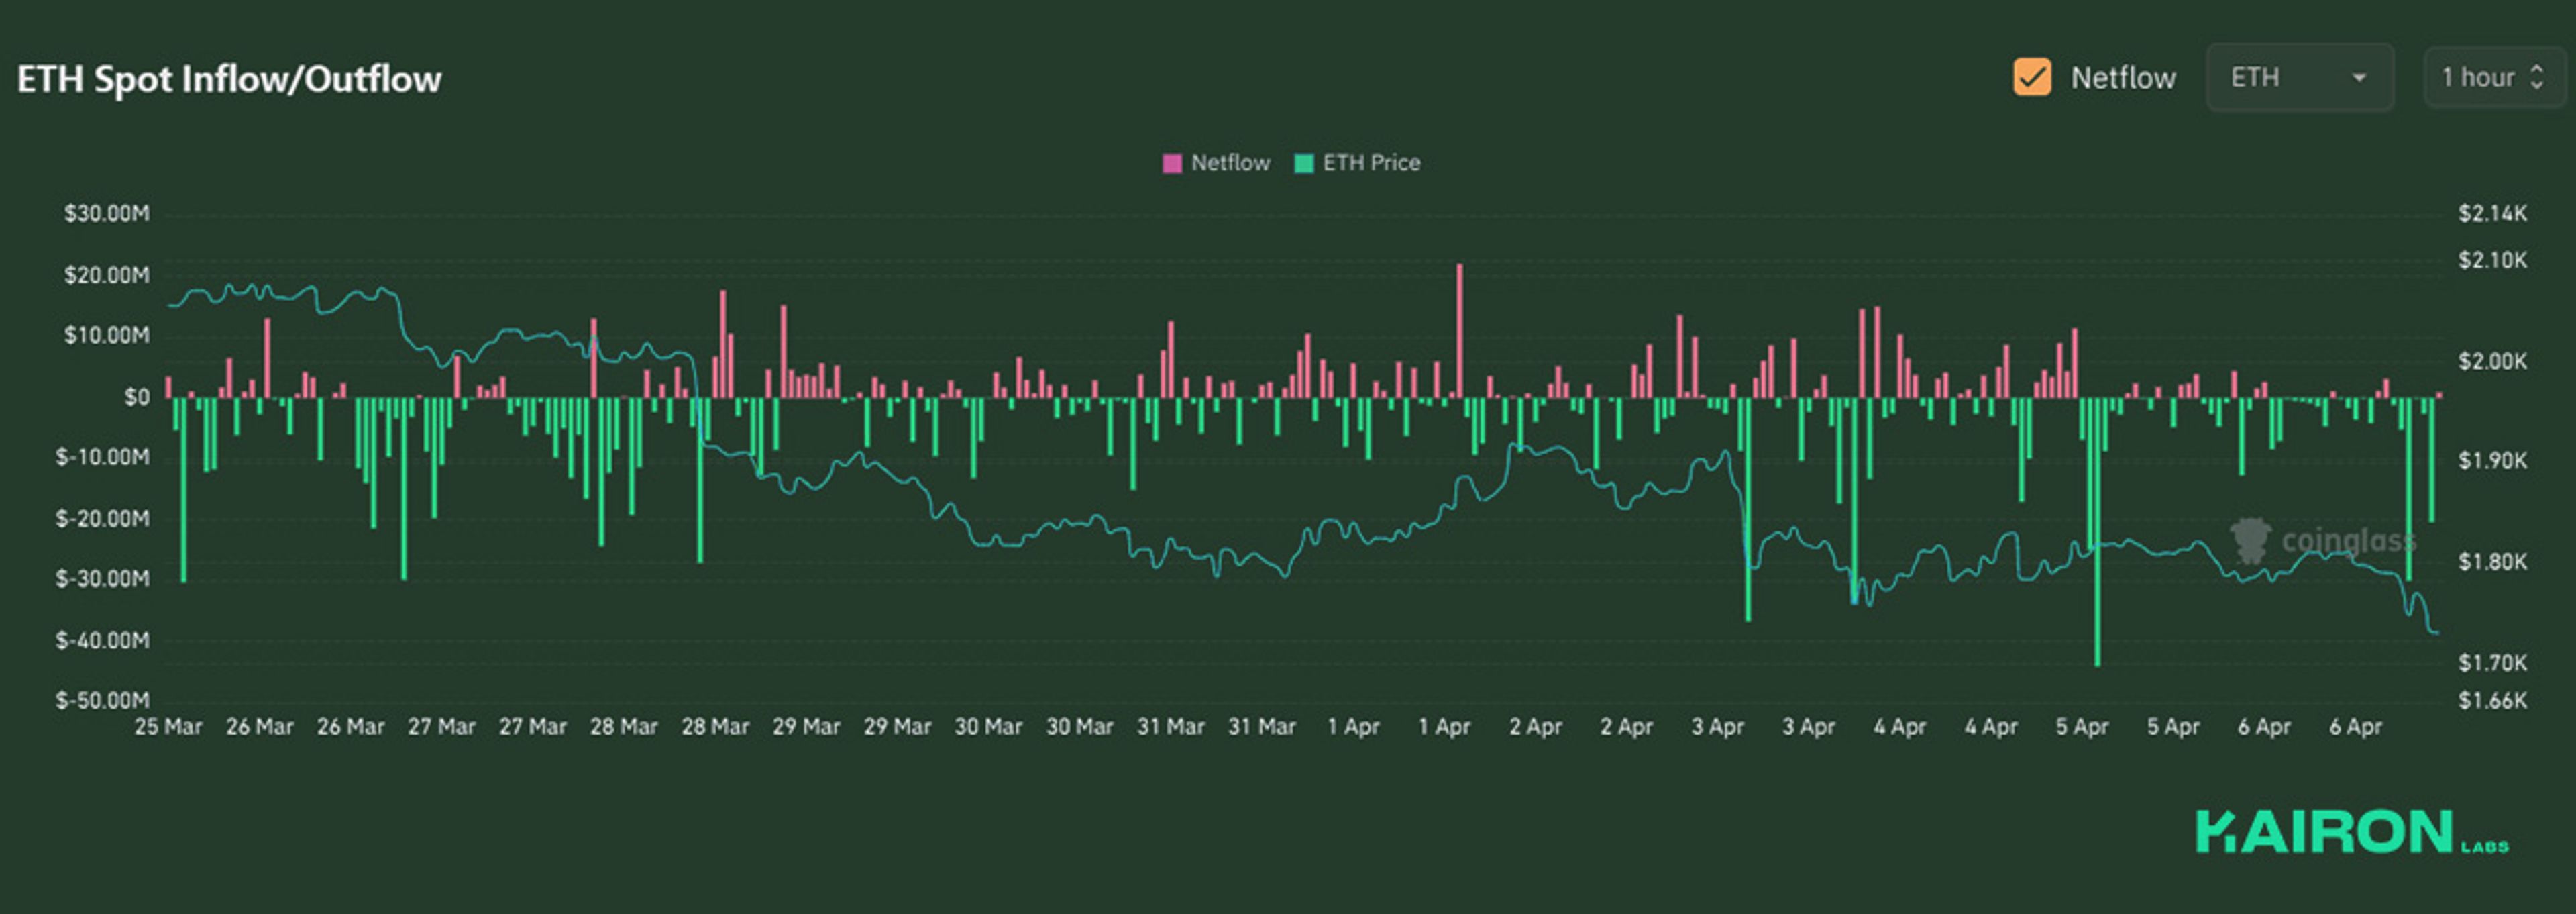
In contrast to BTC, there were no significant spot inflows in the price rally in the lead-up to April 2nd.
This points to a very derivative-driven price rally in ETH.
However, the ensuing fall in price was met with significant outflows.
DISCLAIMER:
The information in this report is for information purposes only and is not to be construed as investment or financial advice. All information contained herein is not a solicitation or recommendation to buy or sell digital assets or other financial products.
This post was prepared by Kairon Labs Trader Patrick Li, Travis Su, and Kenny Lee.
Edited by: Marianne Dasal
Kairon Labs provides upscale market-making services for digital asset issuers and token projects, leveraging cutting-edge algorithmic trading software that is integrated into over 100+ exchanges with 24/7 global market coverage. Get a free first consult with us now at kaironlabs.com/contact