Crypto Market Pulse - August 18, 2025

LAST WEEK RECAP:
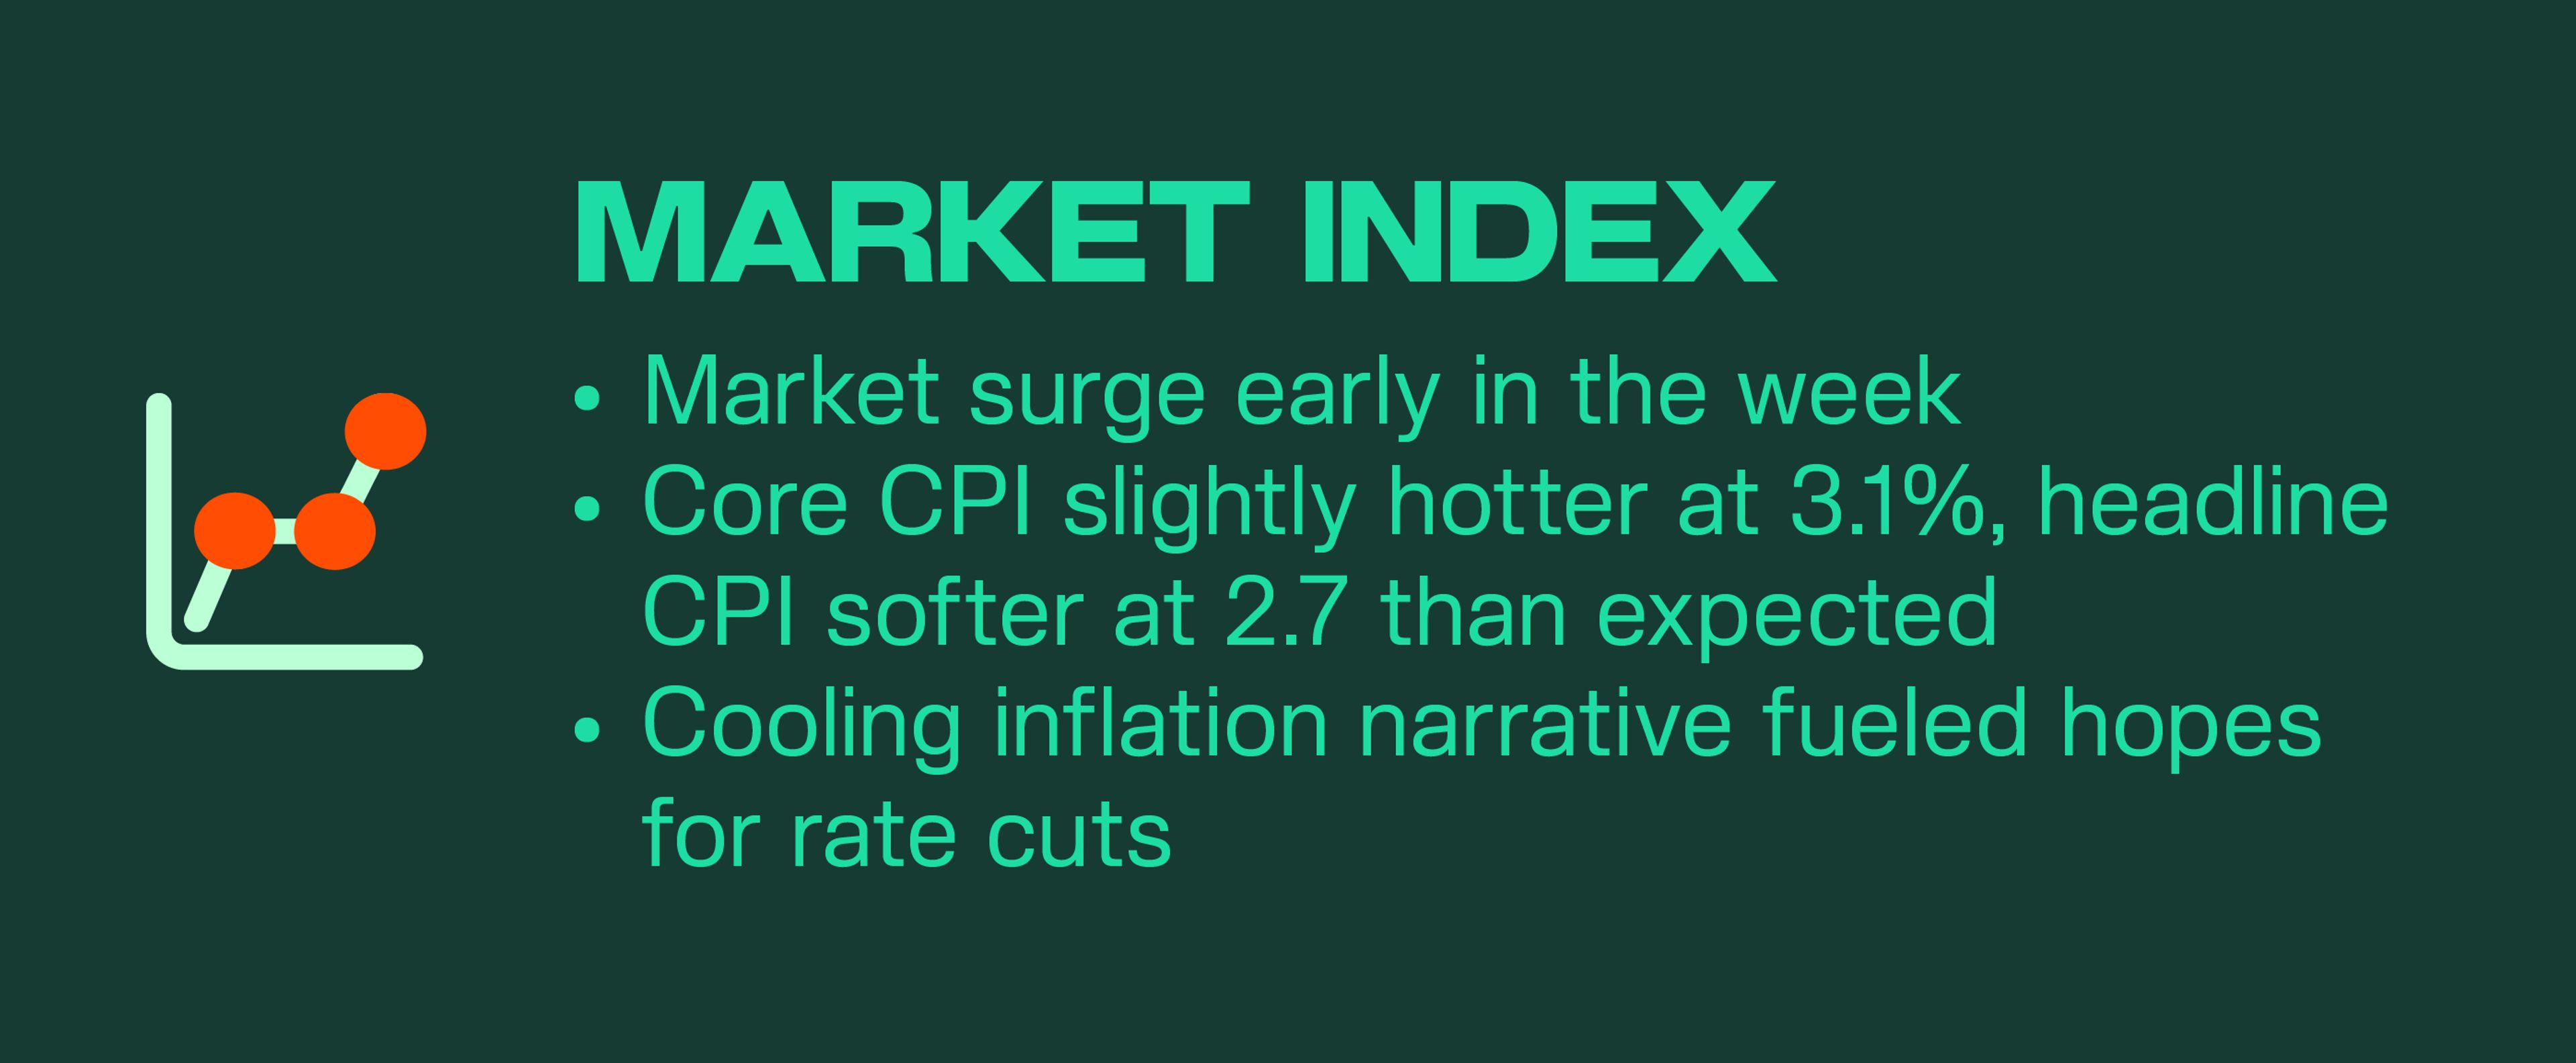
Last week carried forward the momentum of the prior week’s reversal rally, with crypto markets leading the charge to fresh highs—before macro hurdles checked that exuberance and forced a sharp pullback. Early in the week, inflation data gave the market a boost: while Core CPI came in slightly hotter YoY at 3.1% vs 3.0%, headline CPI was softer at 2.7% vs 2.8% expected, enough to fuel optimism around cooling inflation and rate cut hopes.
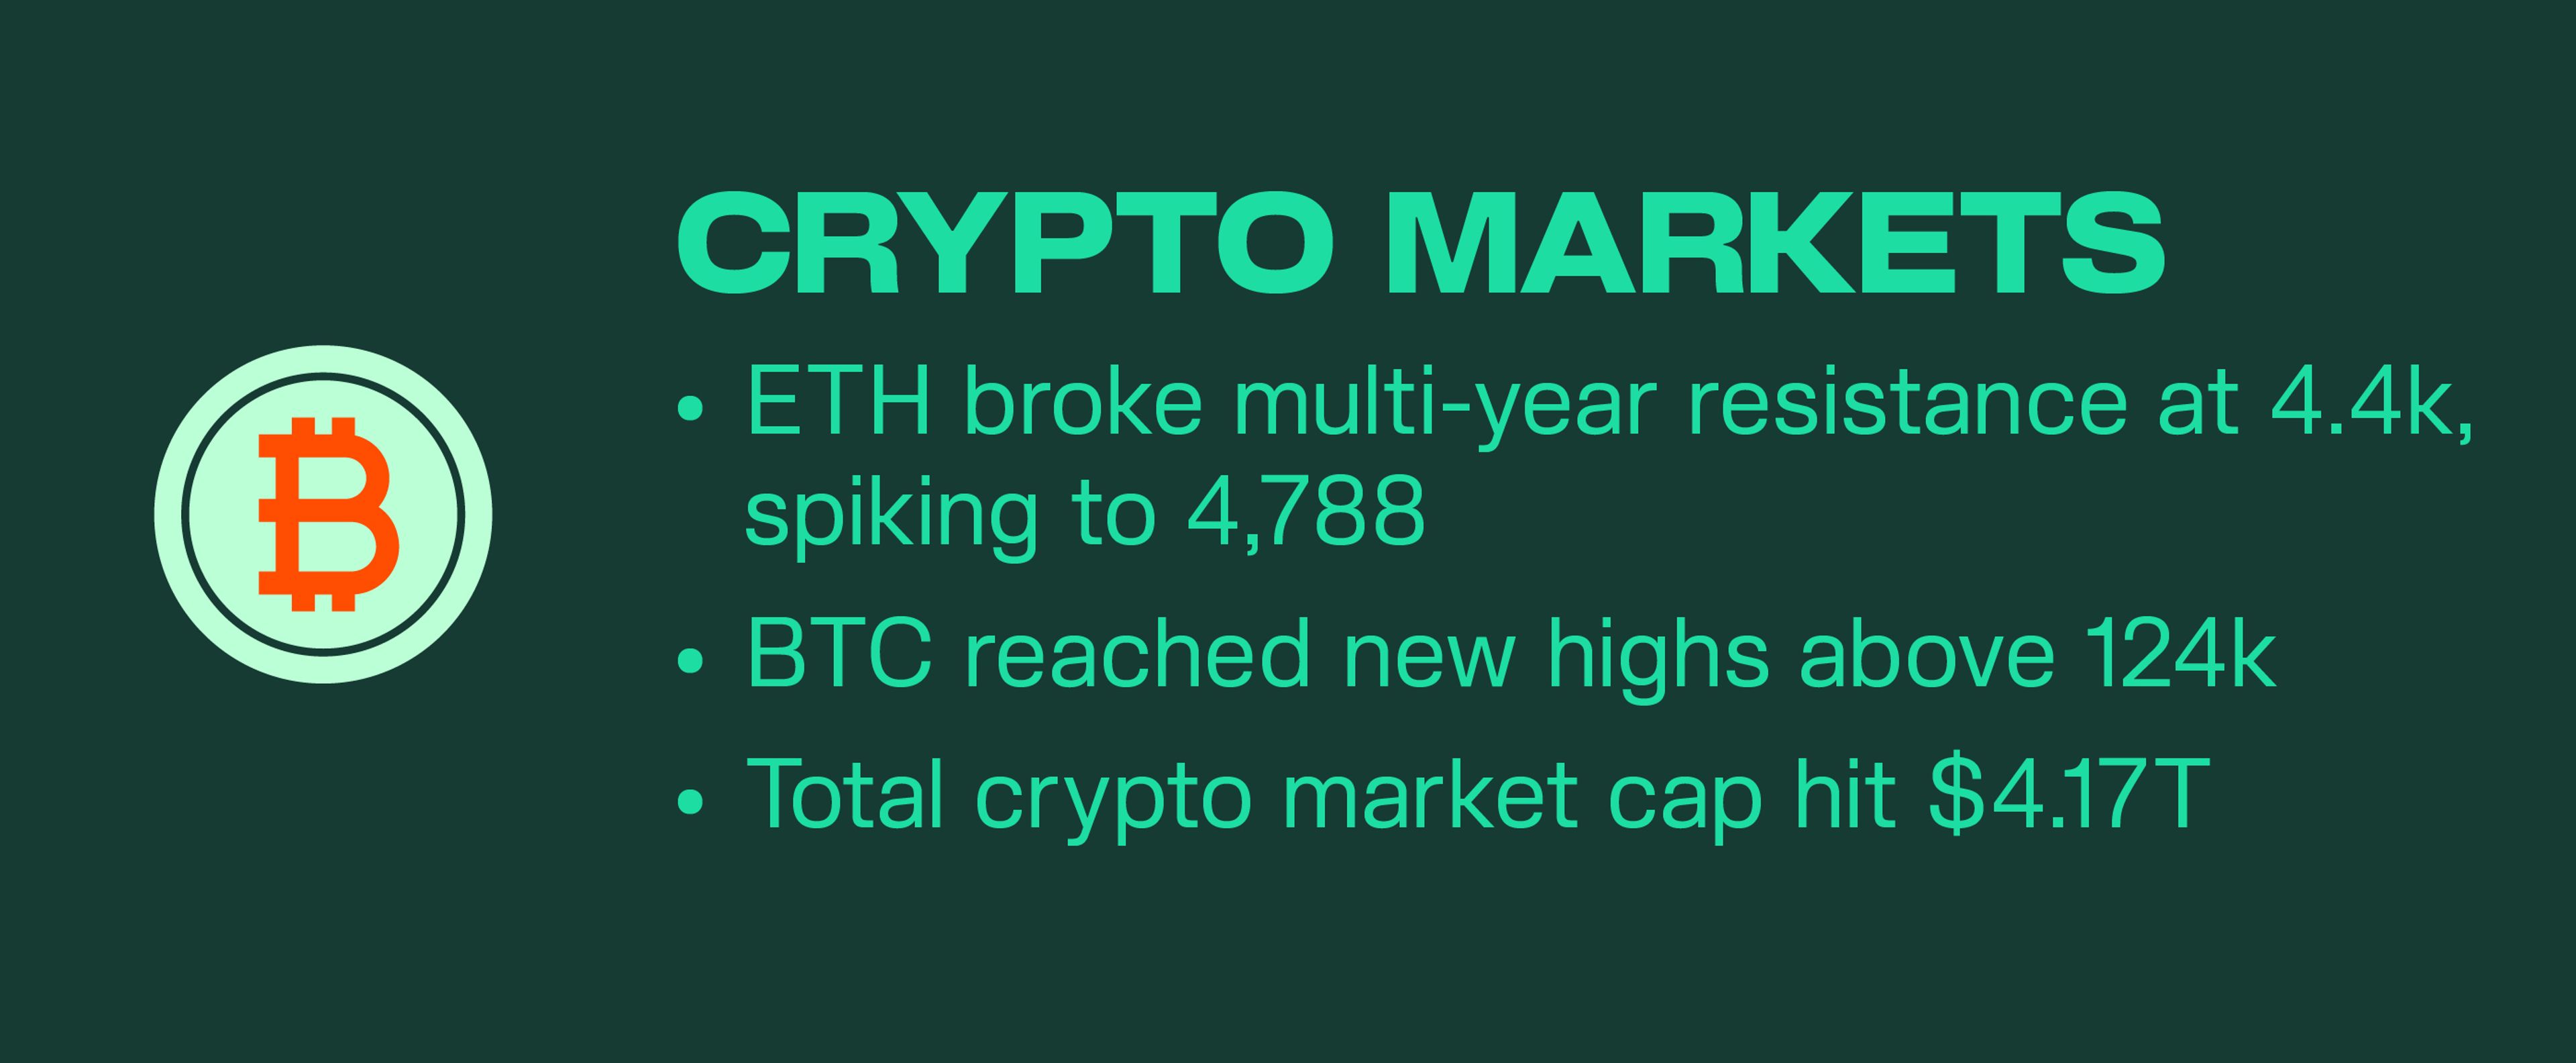
That backdrop, paired with the relentless ETH treasury bids, unleashed a powerful leg higher. ETH broke through the multi-year resistance at 4.4k, ripping to 4,788—just shy of its all-time high at 4,868. BTC notched fresh highs above $124,000, while the total crypto market cap reached $4.17 trillion. Even equities joined the party: the S&P 500 printed new highs at 6,489, underscoring the perfect blend of improving macro sentiment and crypto-specific flows.
But the animal spirits didn’t last. PPI data landed with a thud—US PPI MoM at 0.9% vs 0.2% expected, YoY at 3.3% vs 2.5%—undermining the CPI optimism and trimming September rate-cut odds from ~95% to ~85%. Equities corrected only modestly, with the S&P slipping to 6,465, but crypto took the brunt of the unwind: BTC fell back to 115–116k, ETH slid to 4,381, and Total3 dropped from 4.17T to 3.88T—a key near-term resistance/support flip.
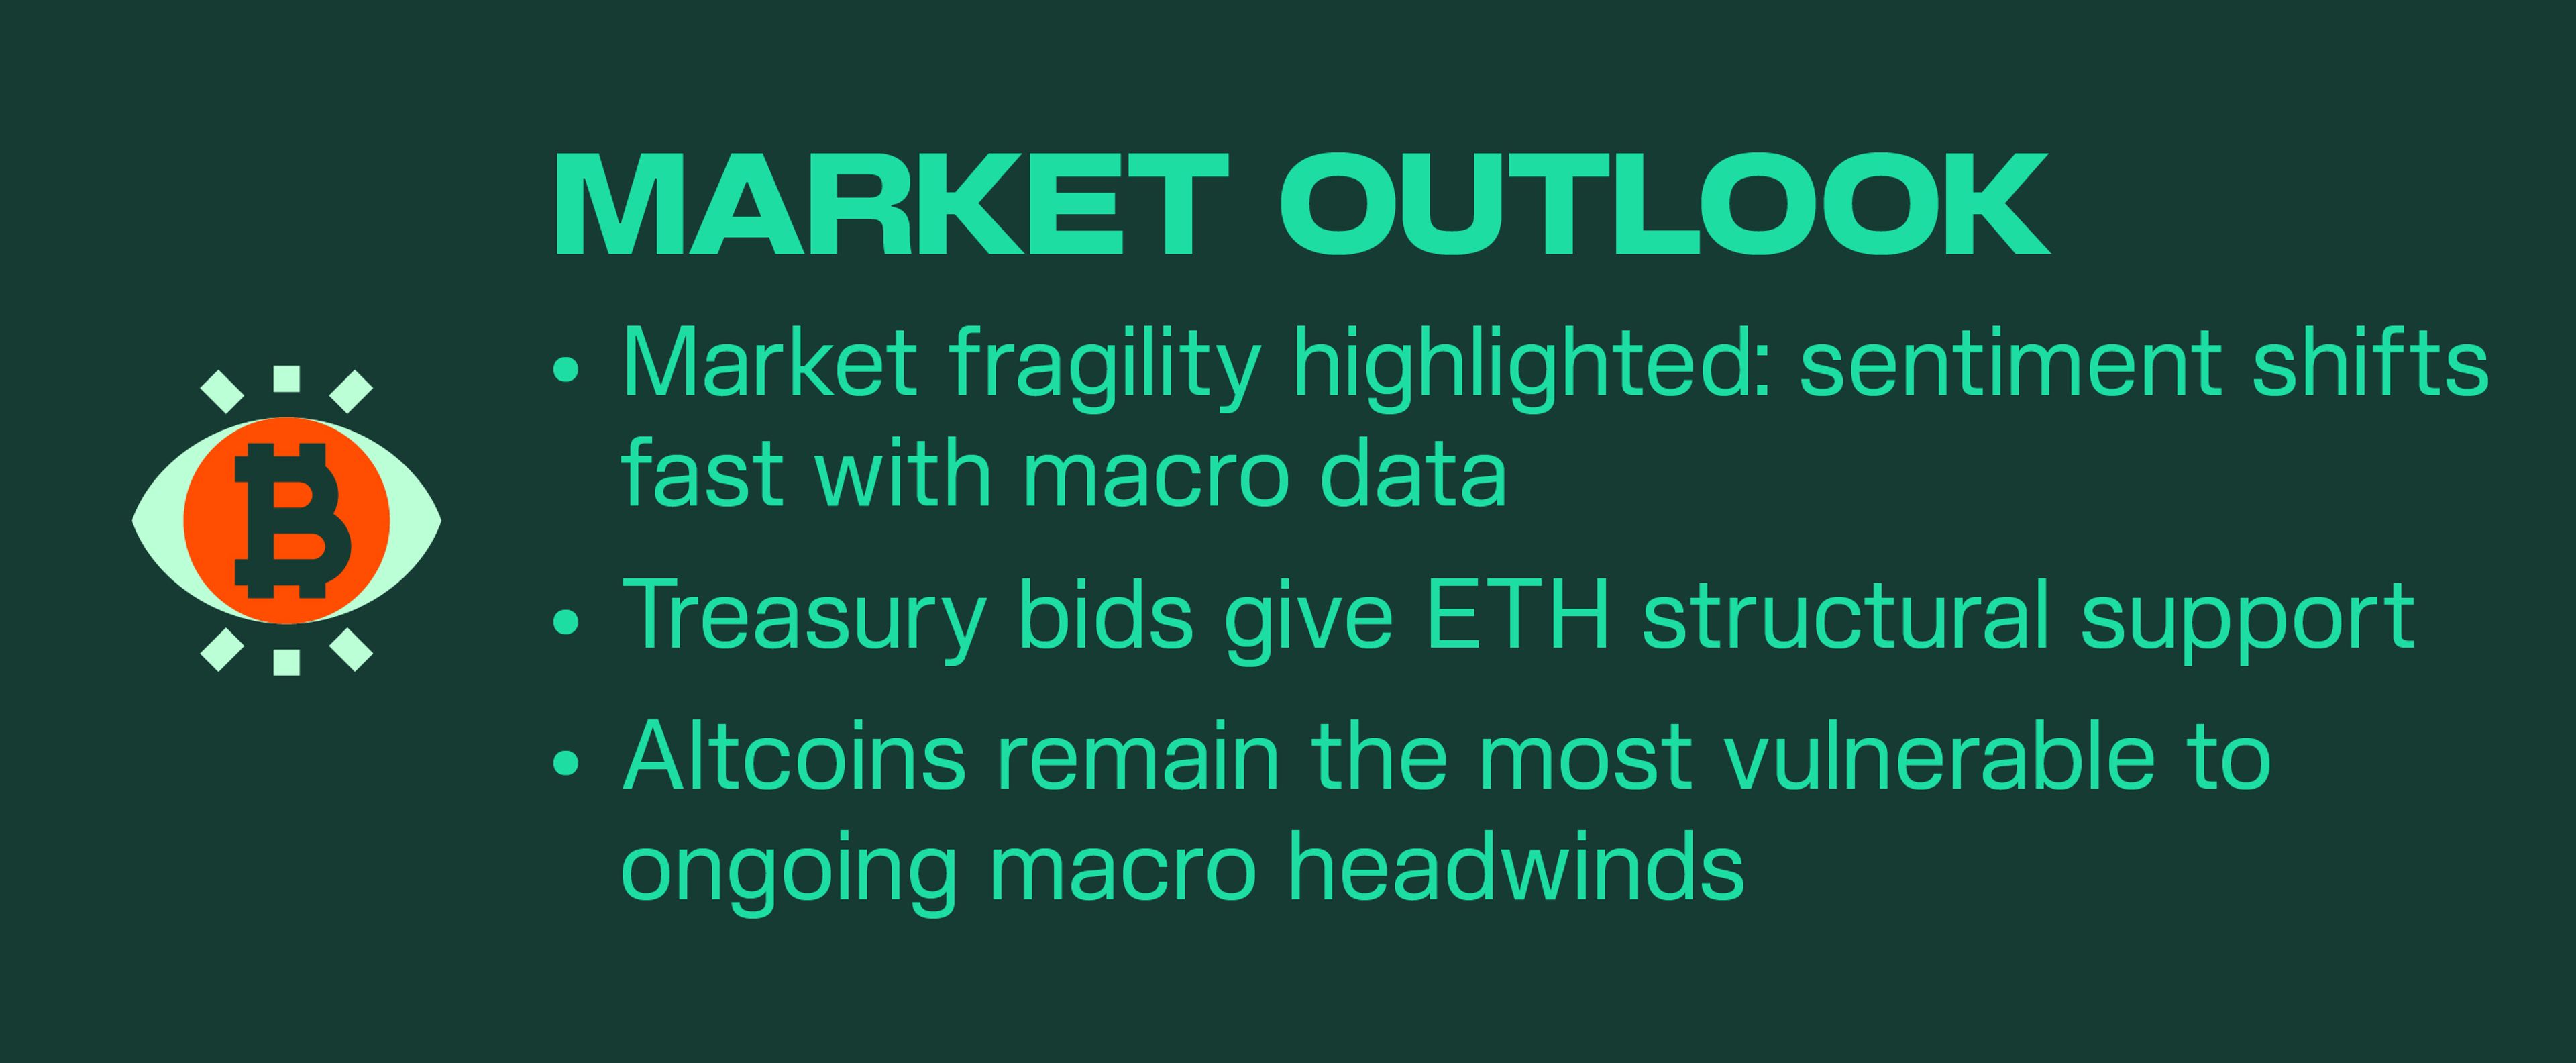
The question now is whether crypto overreacted or equities underreacted. Either way, the week was another reminder of how fragile sentiment is to shifting macro data. Treasury bids provide structural support on the downside and torque on the upside, but the broader altcoin complex remains most vulnerable if macro headwinds persist.
- The UK unemployment rate is at 4.7%, as expected.
- US Core Inflation Rate MoM 0.3% as expected, YoY at 3.1% vs. 3% expected.
- US CPI MoM 0.2% as expected, YoY at 2.7% vs. 2.8% expected.
- Australia's Unemployment Rate Is 4.2%, as expected.
- UK GDP MoM 0.4% vs. 0.1% expected.
- US PPI MoM 0.9% vs. 0.2% expected, YoY 3.3% vs. 2.5% expected.
- China Retail Sales YoY 3.7% vs. 4.6% expected.
- China Unemployment Rate 5.2% vs. 5.1% expected.
- US Retail Sales MoM 0.5% as expected.
BTC WEEKLY VIEW
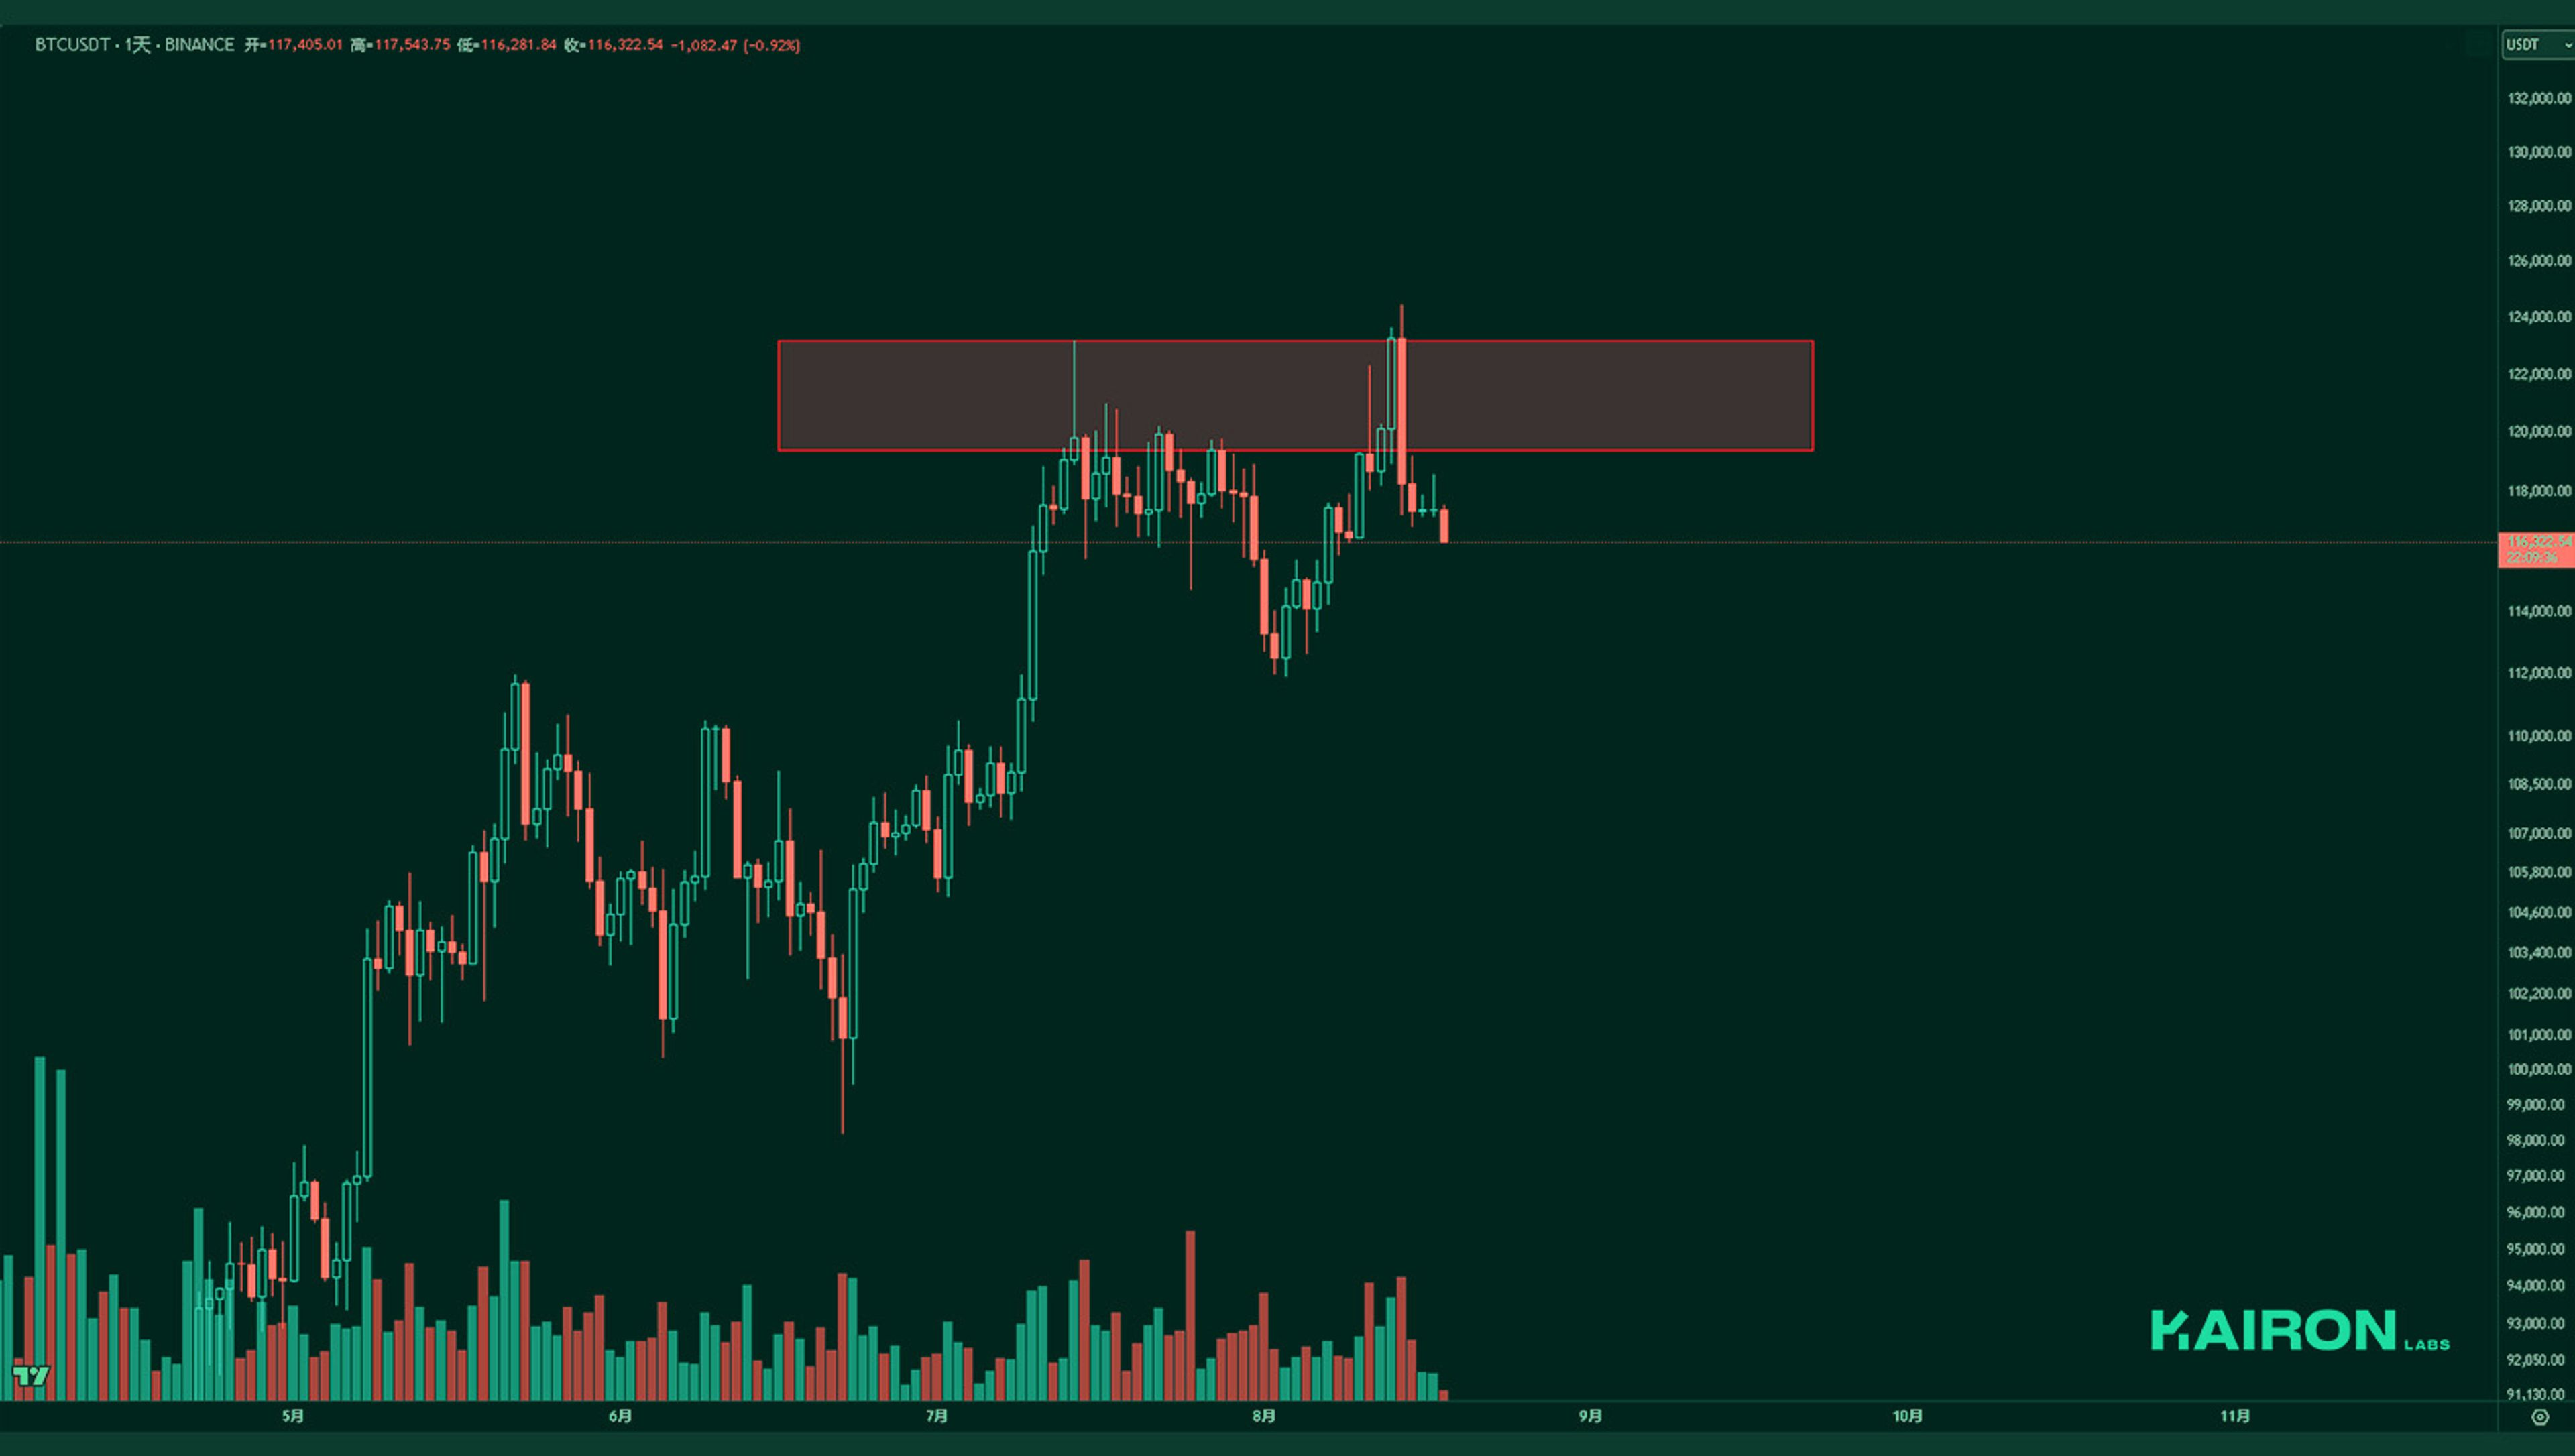
On the daily chart, BTC showed a false breakout around the 120k level, followed by a bearish engulfing move. If the downside extends from here, BTC could be forming a potential top. Until the price recovers to around 124k, the upside potential is likely to remain very limited.
ETH WEEKLY VIEW
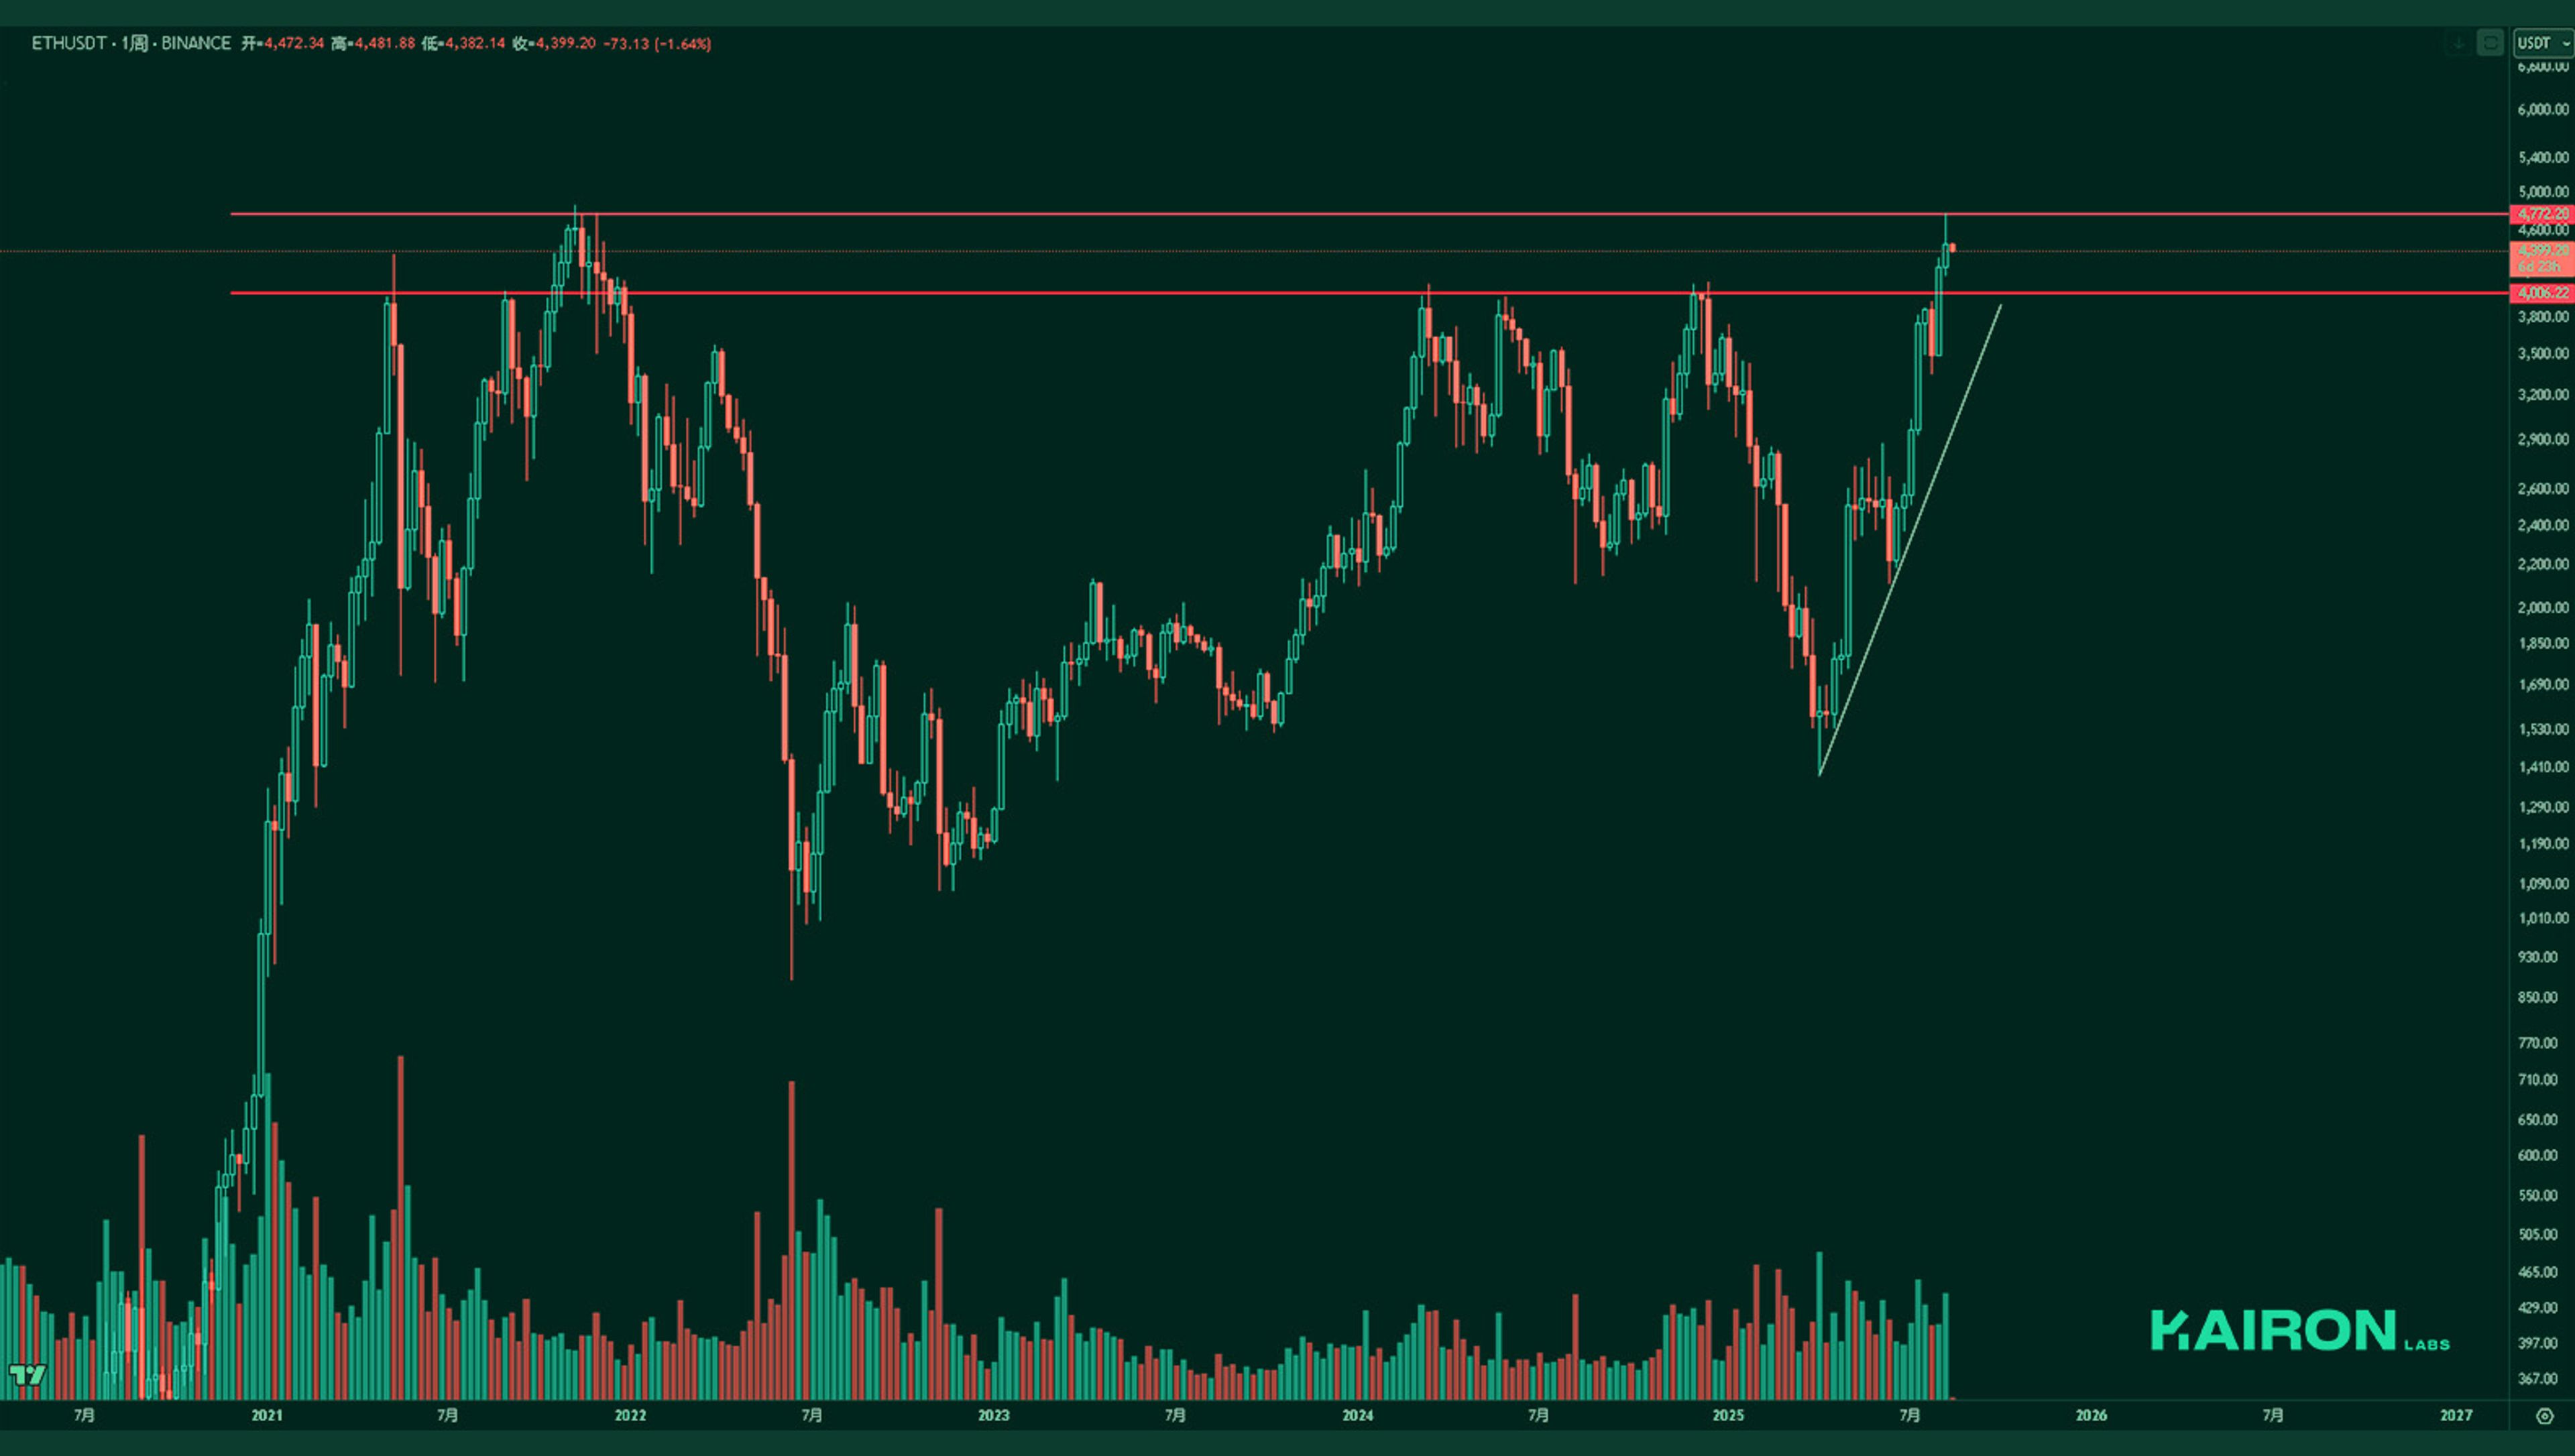
Last week, ETH did not retest its previous resistance level but instead went straight up to the 2021 all-time high before pulling back slightly. If the trend remains bullish, the price is unlikely to break through the previous high in one move and may still need some consolidation here before attempting another breakout.
ETH/BTC
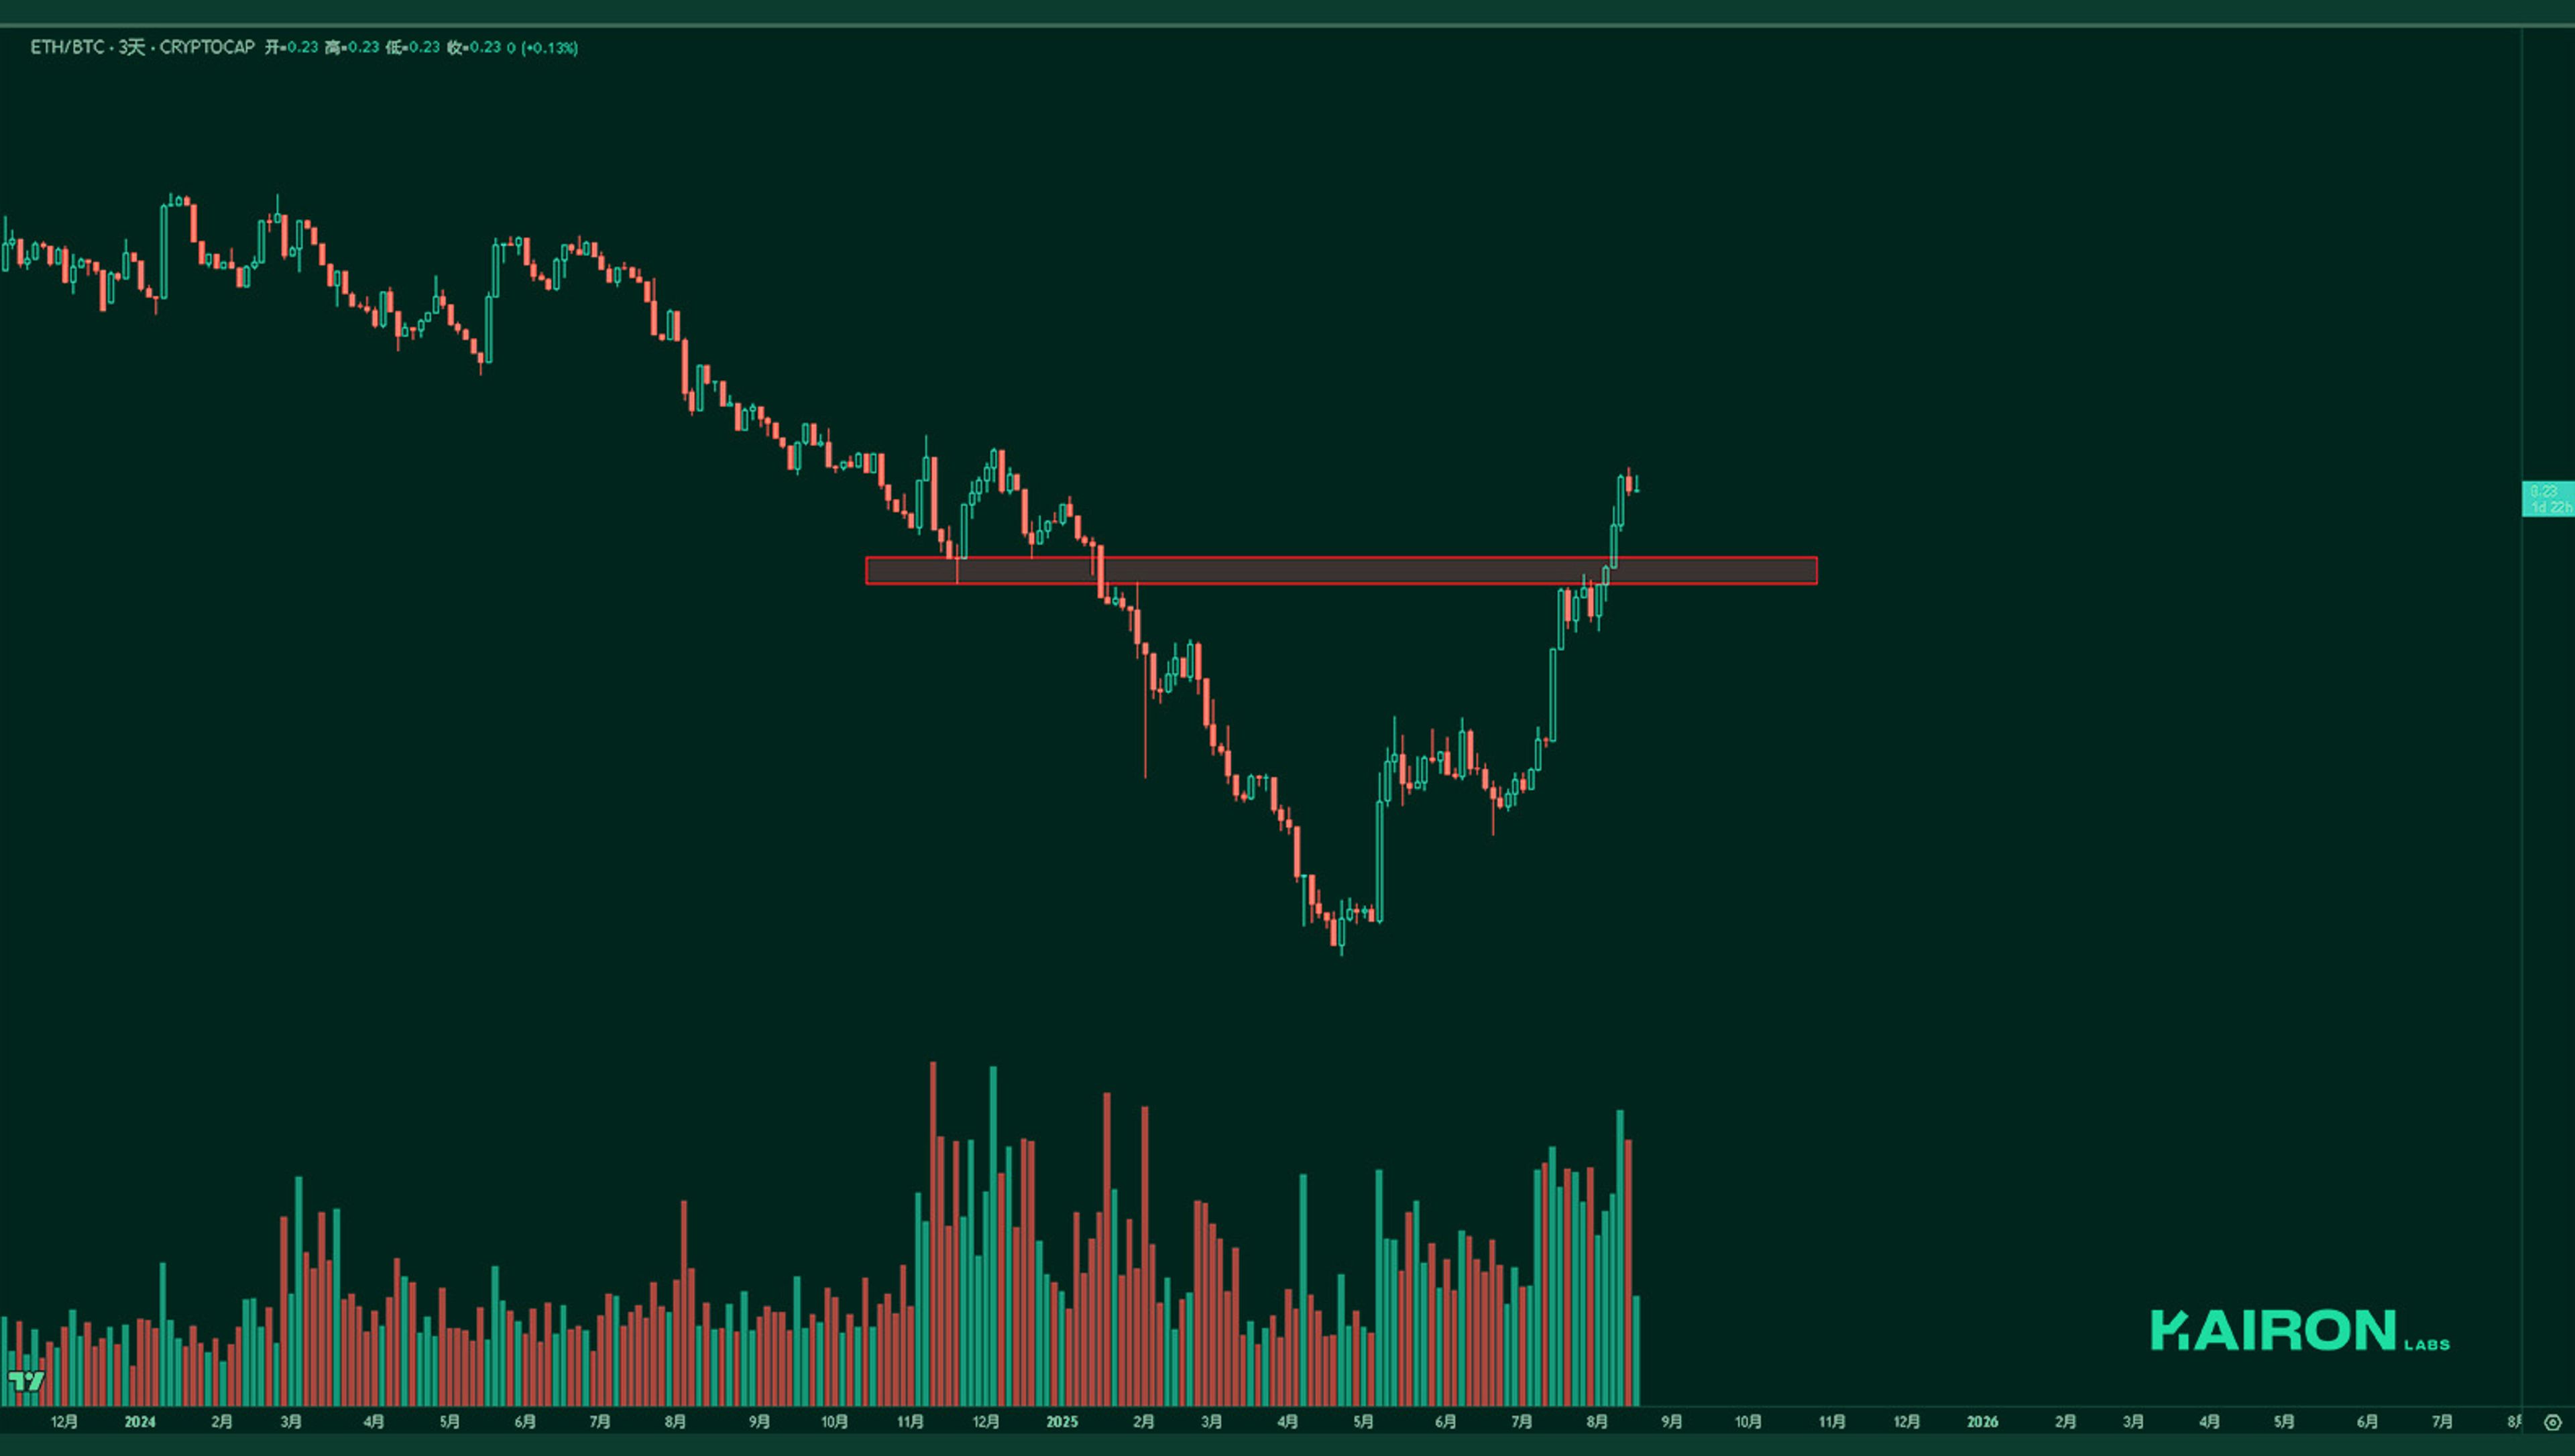
After a week of ETH consistently outperforming BTC, a brief correction may be needed before the trend continues. That said, it’s undeniable that ETH is still showing stronger relative performance compared to BTC.
TOTAL3 USD MARKET STRENGTH
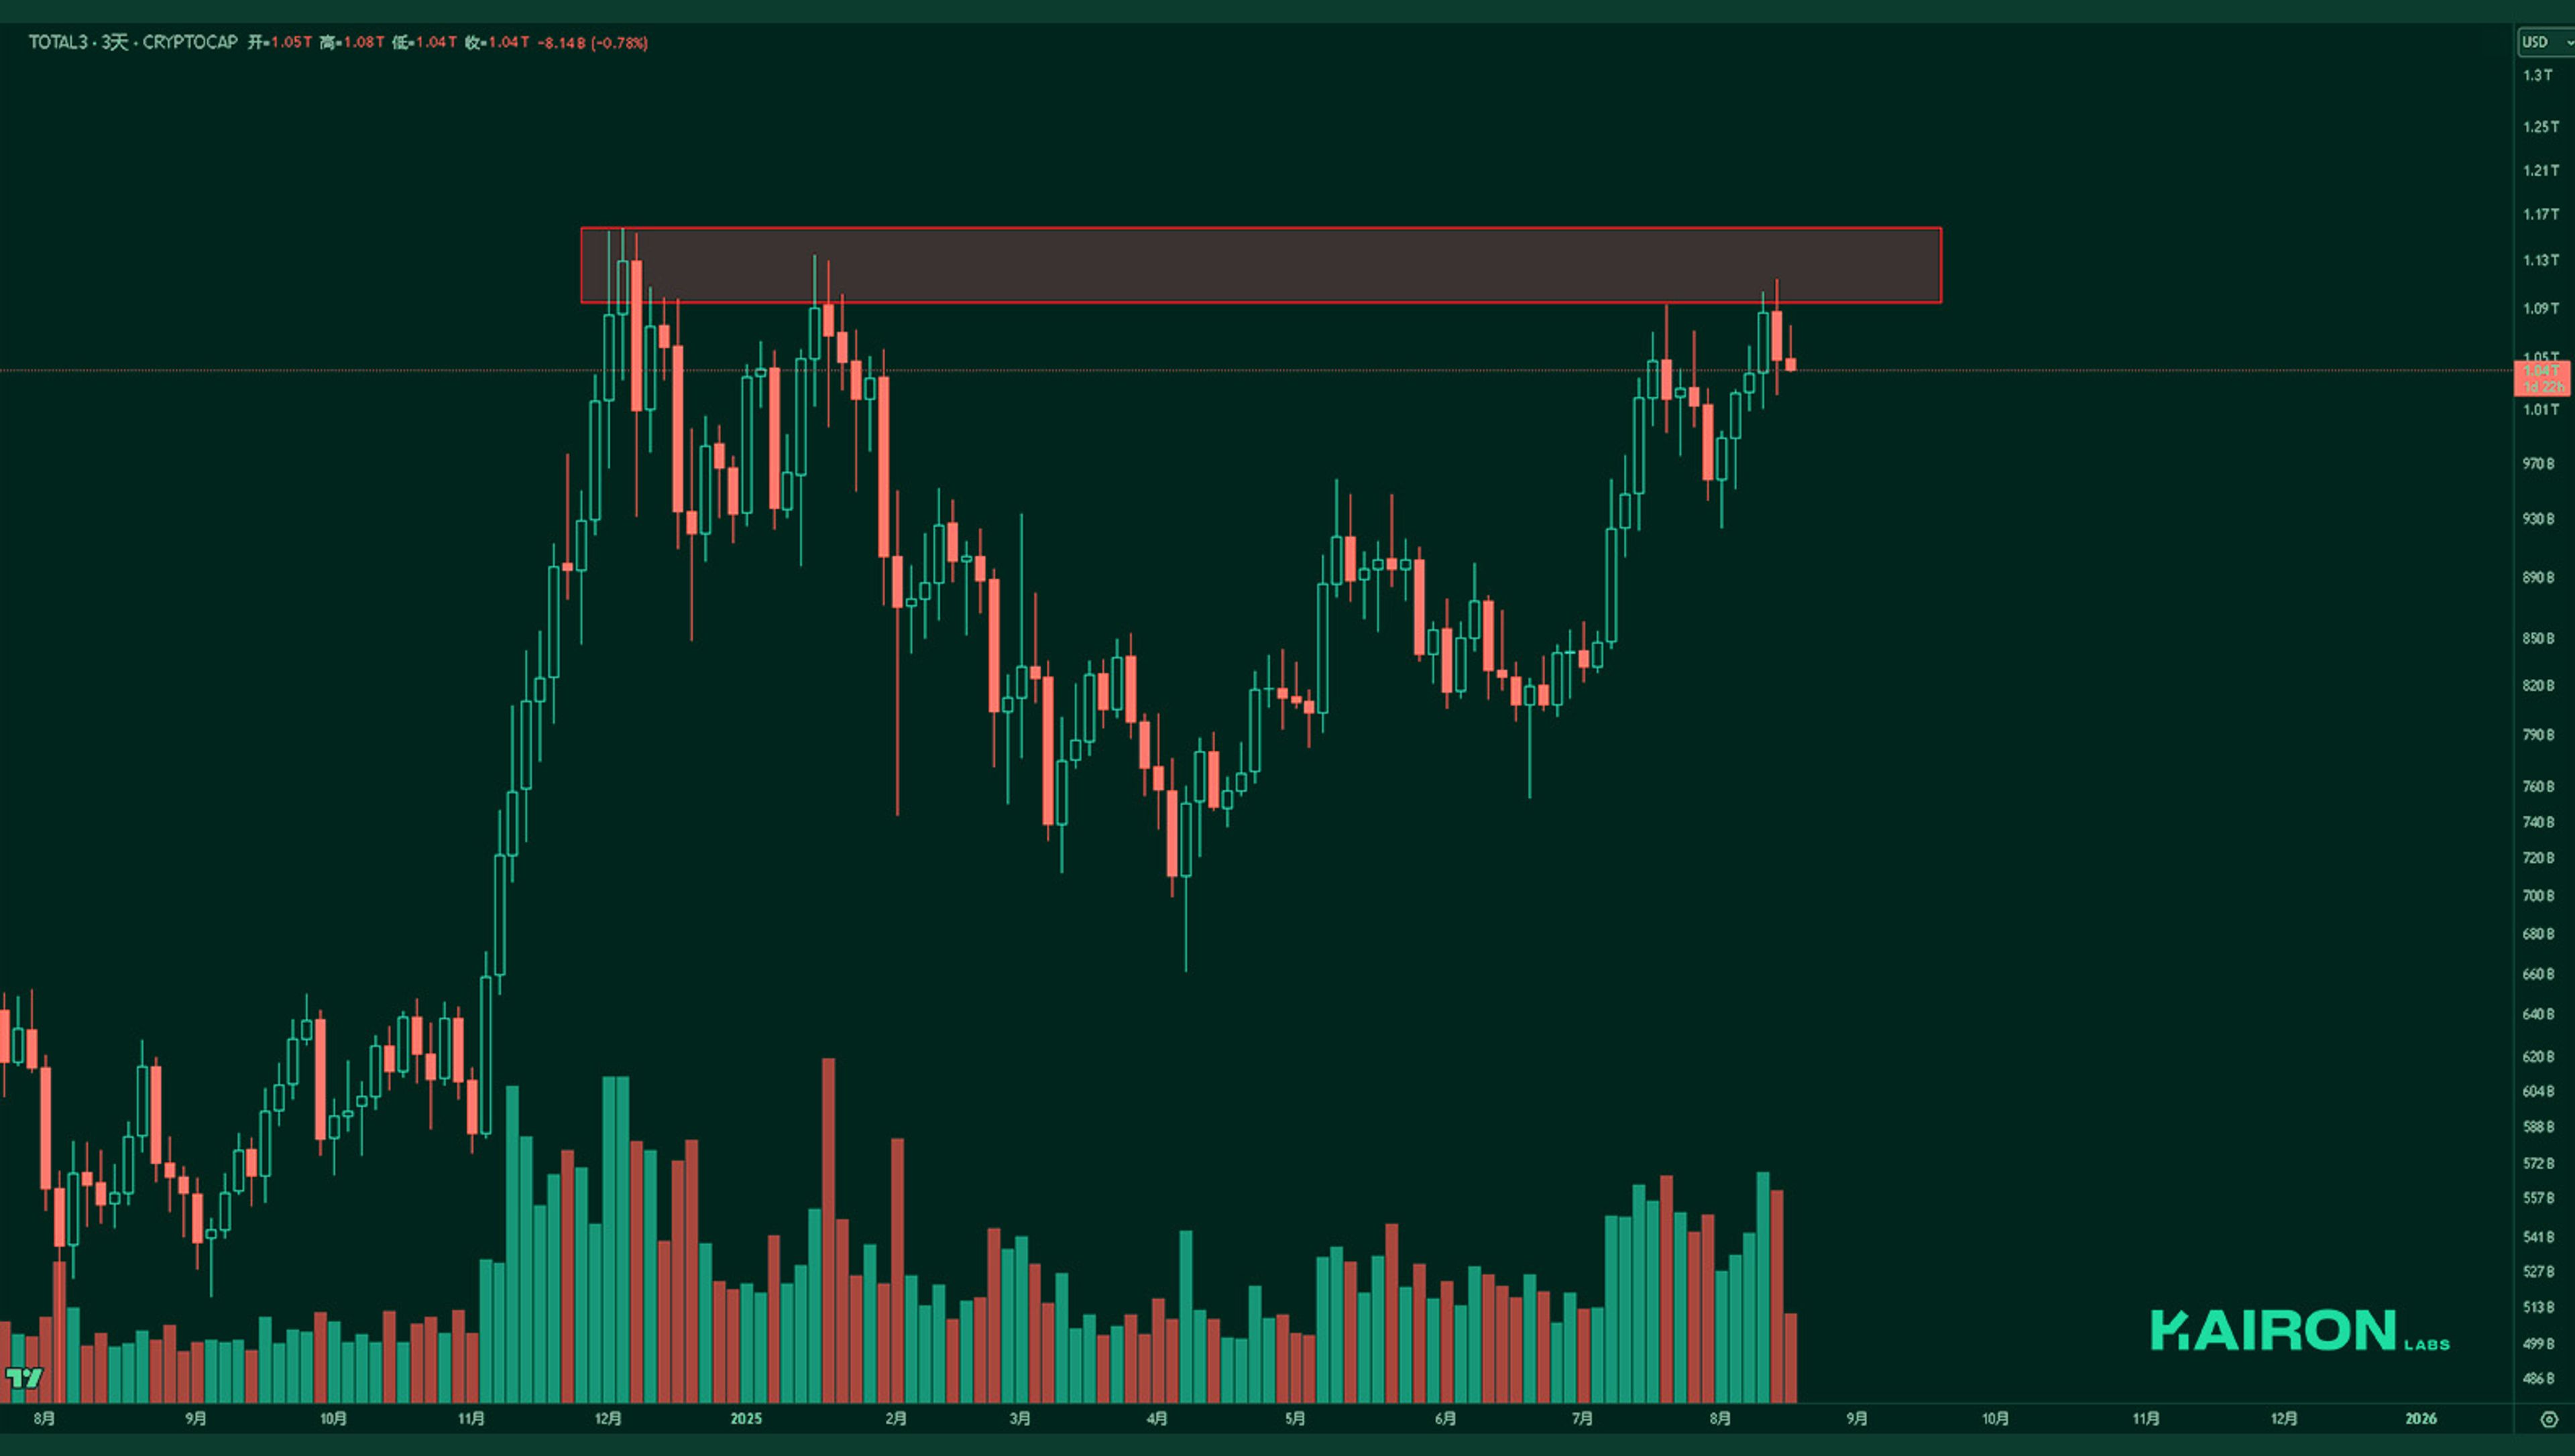
TOTAL3 is showing signs of a reversal near the supply zone we previously highlighted. This area may require a period of consolidation before either breaking higher or forming a potential top and reversing downward, so it’s a key level to keep monitoring closely.
TOTAL3 BTC MARKET STRENGTH
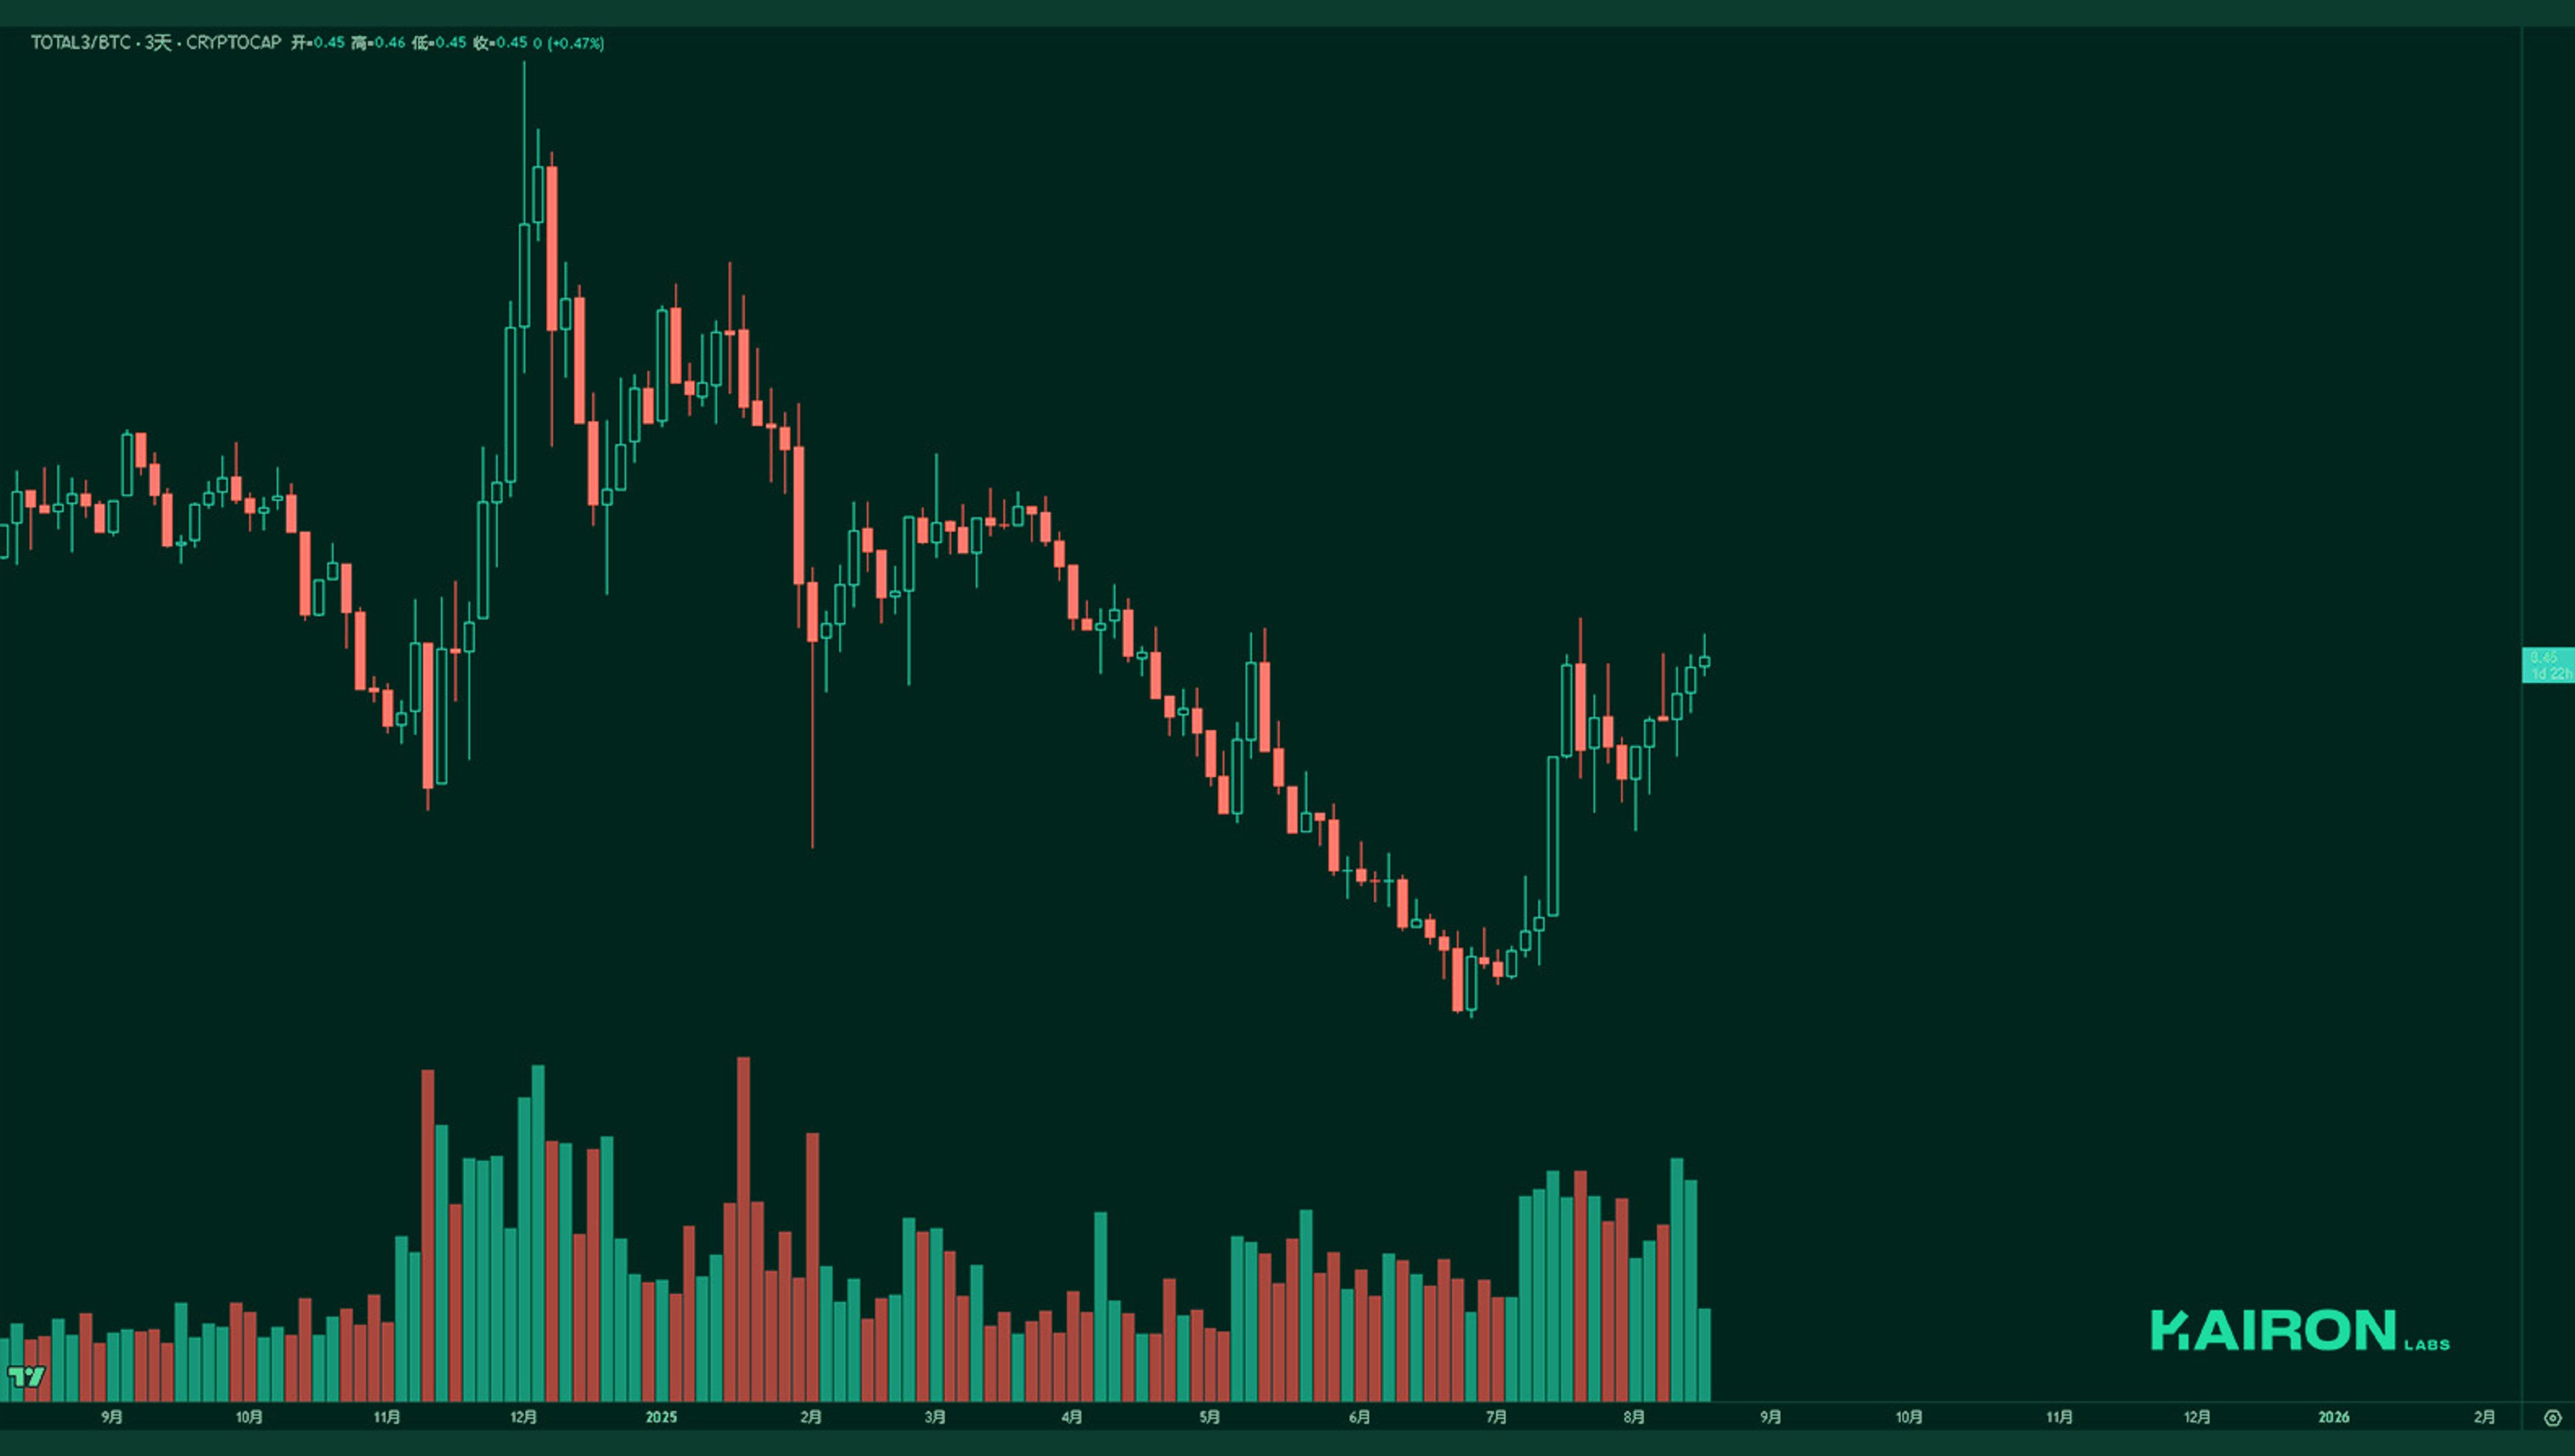
After both BTC and TOTAL3 experienced relatively weak pullbacks, they may continue to show some weakness on both sides. At present, BTC and TOTAL3 are displaying a degree of fragility, and the short-term market could lean toward a weak consolidation. If BTC fails to quickly reclaim key levels (such as the 124k recovery), TOTAL3’s relative strength is also likely to be limited. In other words, the current setup looks more like a phase of waiting for confirmation rather than an extended trend.
MARKET LEVERAGE RATIO
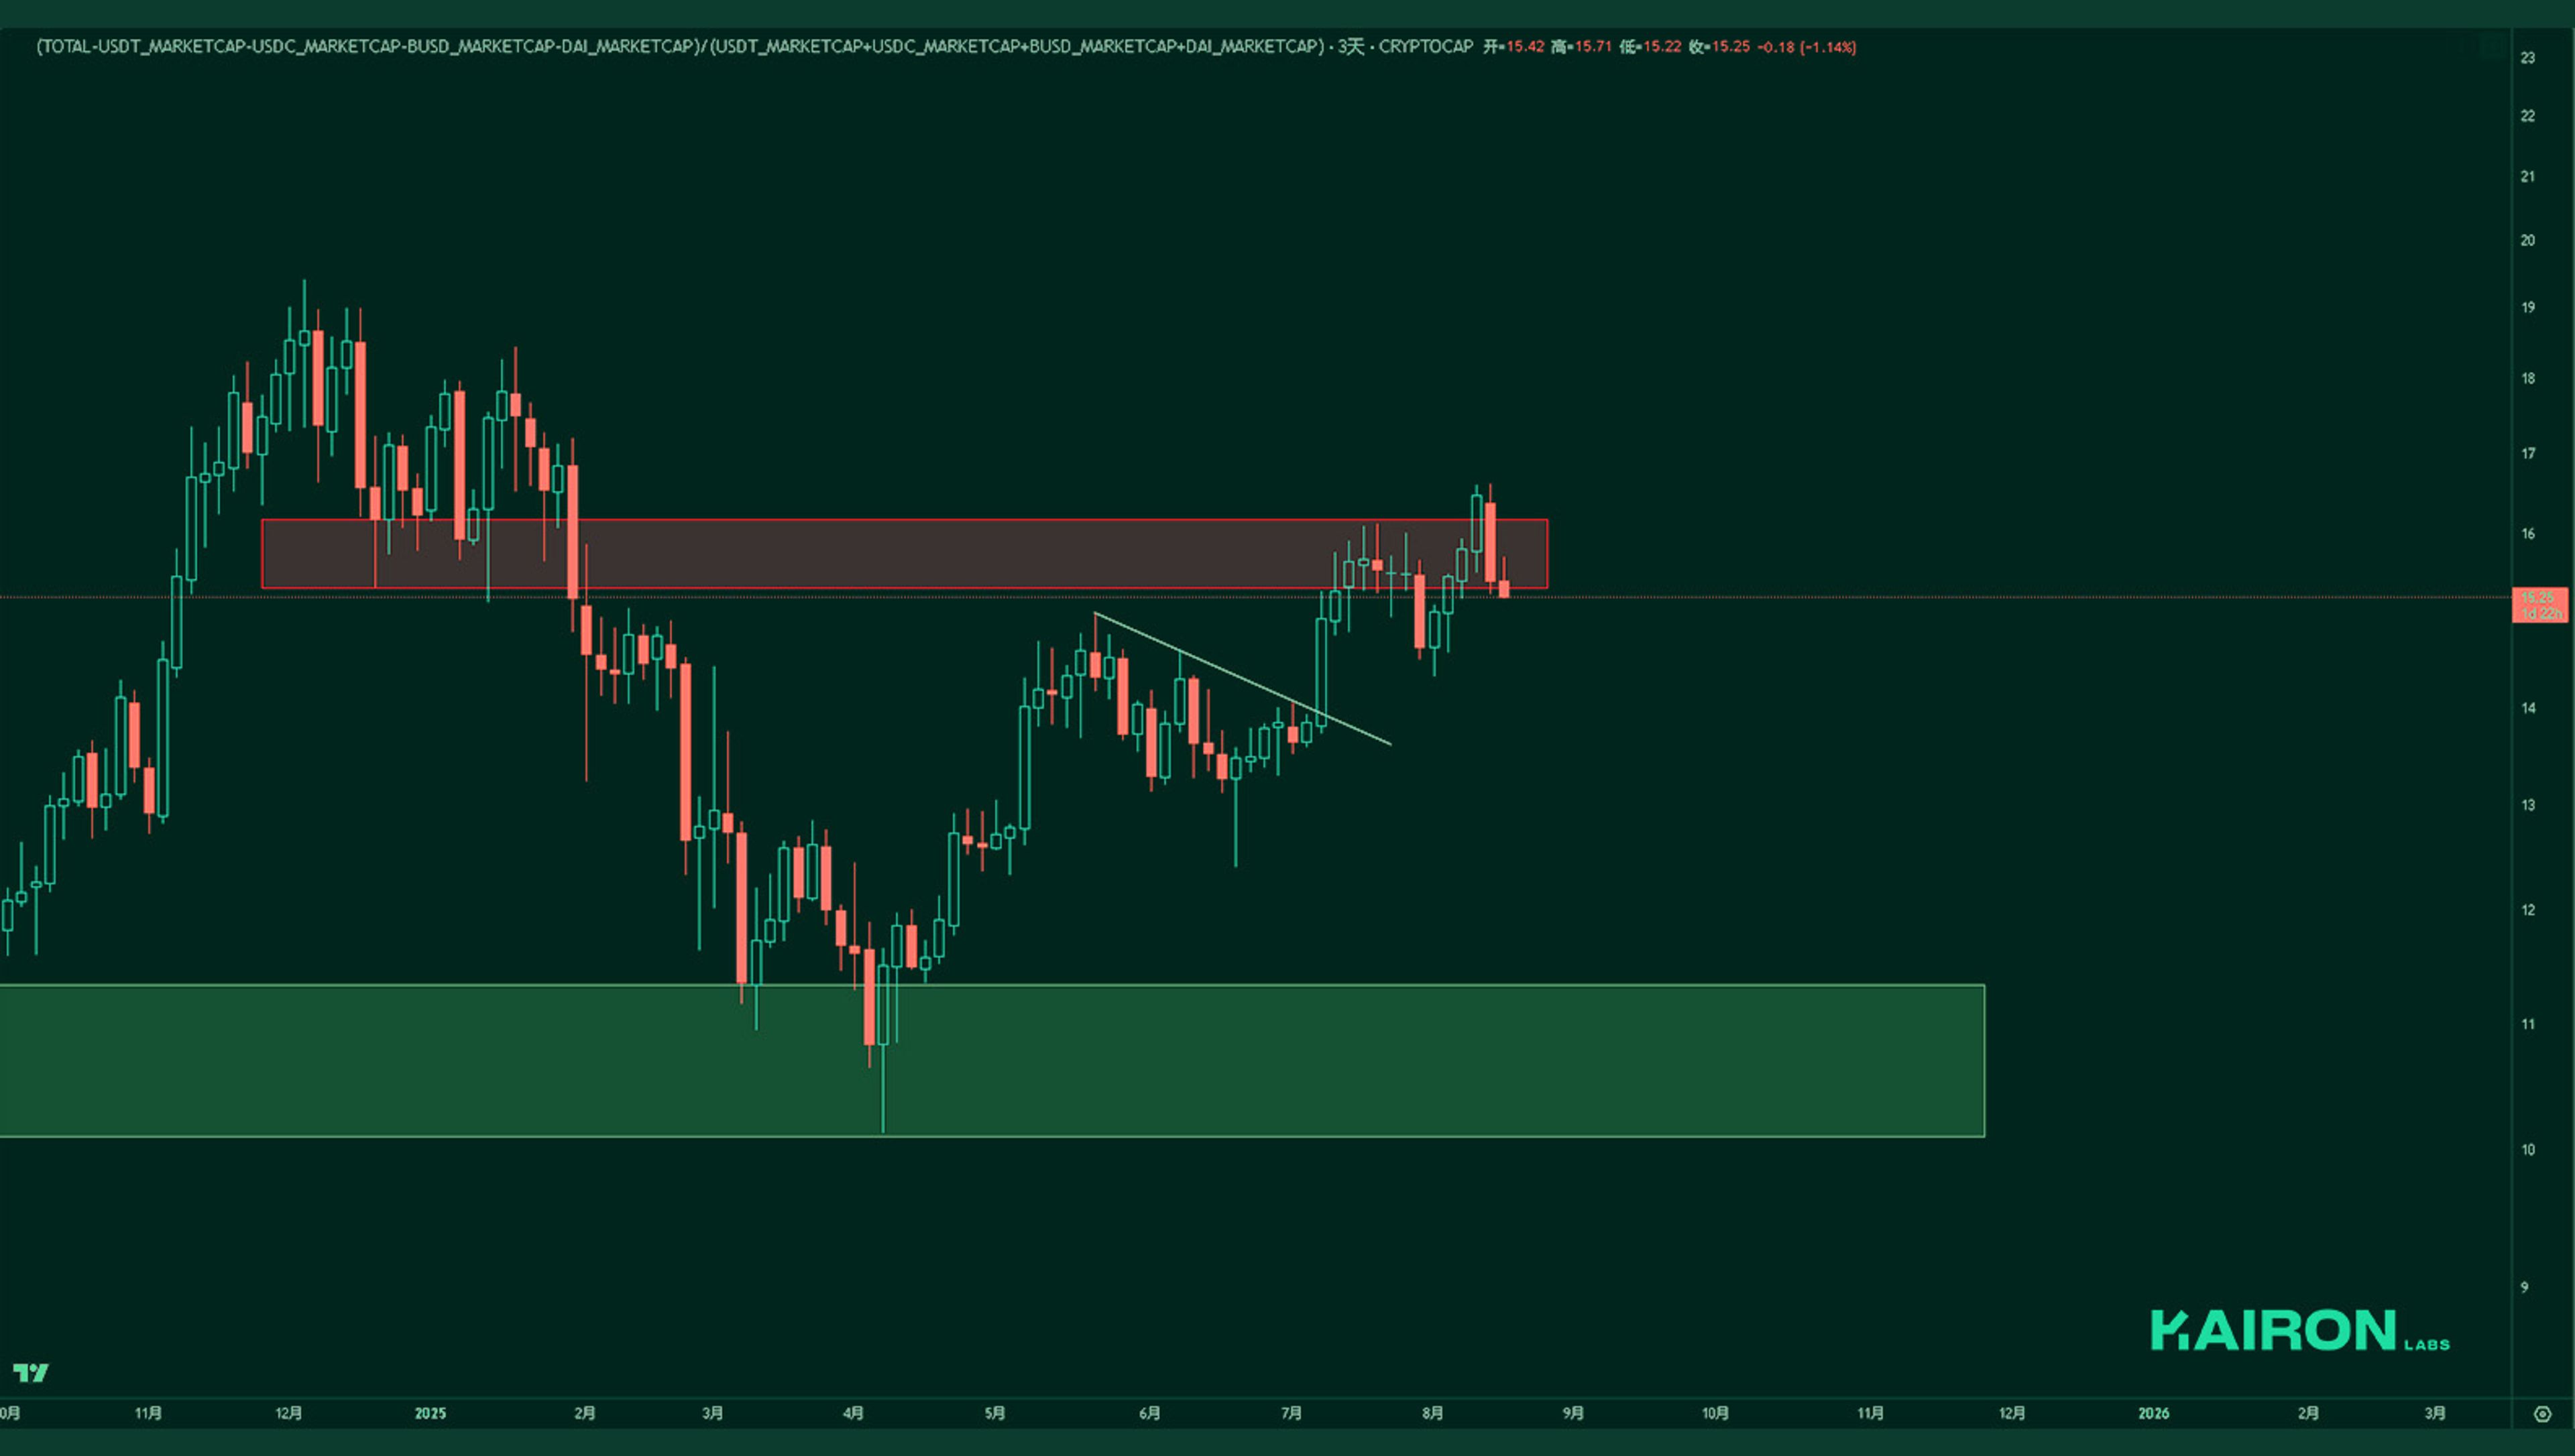
The market leverage ratio is showing weakness near the supply zone, with clear signs of reversal to the downside. This suggests that short-term profit-taking is occurring among participants, indicating rising risks that need to be closely monitored.
SUMMARY
- Crypto markets rallied early last week, fueled by softer CPI data (2.7% vs 2.8% expected) and ETH treasury bids, with ETH breaking 4.4k resistance to hit 4,788 and BTC reaching 124k.
- Hotter-than-expected PPI data (0.9% MoM vs 0.2%, 3.3% YoY vs 2.5%) reduced rate-cut odds from ~95% to ~85%, triggering a crypto pullback, with BTC at 115–116k and Total3 at 3.88T.
- Equities were resilient, with the S&P 500 only slipping to 6,465, but crypto’s sharp reaction underscores its macro sensitivity, though treasury bids provide downside support.
DISCLAIMER:
The information in this report is for information purposes only and is not to be construed as investment or financial advice. All information contained herein is not a solicitation or recommendation to buy or sell digital assets or other financial products.
This post was prepared by Kairon Labs Traders Patrick Li, Travis Su, and Kenny Lee.
Edited by: Shirley Castro
Kairon Labs provides upscale market-making services for digital asset issuers and token projects, leveraging cutting-edge algorithmic trading software that is integrated into over 100+ exchanges with 24/7 global market coverage. Get a free first consult with us now at kaironlabs.com/contact
Featured Articles


Understanding Market-Making Models in Crypto

Cointelegraph: Kairon Labs Sheds Light on What Real Market Makers Do

Launching a Token 101: Why is Liquidity Important?

Airdrops and Retrodrops Decoded: A Comprehensive Guide
