Knowledge Bank
Crypto Bullruns Past and Present
Apr 2024
By Kairon LabsKnowledge Bank
Markets kicked off the week riding a wave of optimism. The S&P 500 pushed to new highs, briefly touching 6,055, while Bitcoin climbed back toward 110k, buoyed by twin catalysts: a long-awaited trade truce with China and softer-than-expected U.S. inflation data.
The White House confirmed that a trade deal had been finalized and was awaiting signatures from Presidents Trump and Xi. The deal carried sweeping implications—Beijing agreed to supply rare earth elements critical to American industries like autos and semiconductors, while both nations agreed to dramatically scale back tariffs. The U.S. will cut tariffs to 55% from 145%, and China will follow suit, dropping tariffs from 125% to 10%. The rare display of diplomatic accord offered hope that inflationary pressures tied to supply chains might abate, just in time for the latest CPI numbers to confirm the trend.
Inflation data landed well below expectations. Core CPI came in at just 0.1% month-on-month (vs 0.3% expected), while headline CPI followed suit, both on a monthly and annualized basis. The market interpreted the print as yet another green light for the Fed to stay patient—and potentially pivot dovish into year-end.
But the rally was short-lived.
Late in the week, geopolitical risk made a violent re-entry. Israel launched a surprise strike on Iranian nuclear facilities, reportedly killing several top Iranian military figures. Iran responded with missile barrages, and President Trump quickly escalated rhetoric, threatening Iran with further action should it reject a new “deal.” The conflict marks a sudden shift in risk dynamics—just as markets were pricing in a smooth de-escalation in China–U.S. trade tensions, a new front of volatility has emerged.
The shift was evident across asset classes. The S&P 500 gave back gains to close the week down ~0.5% at 5,976. Crude oil surged to $72.98 as energy traders priced in disruption risks, while Bitcoin retreated from 110k to hover around 105k. The broader altcoin market wasn’t spared either, with TOTAL3 dropping 6.6% from the week’s highs to end around 835 billion in market cap.
Just when it seemed that one major geopolitical threat was being priced out, another has emerged to take its place. As this latest conflict unfolds, the market will be watching closely for signs of broader contagion, particularly on inflation expectations. Bitcoin’s claim as a geopolitical hedge may soon face its most serious test in months. Volatility, once again, is back in the driver’s seat.

From a weekly perspective, BTC is still consolidating within a relatively reasonable range, with no clear signs of a top being formed. We still need to wait for it to decisively break out in either direction at some point.
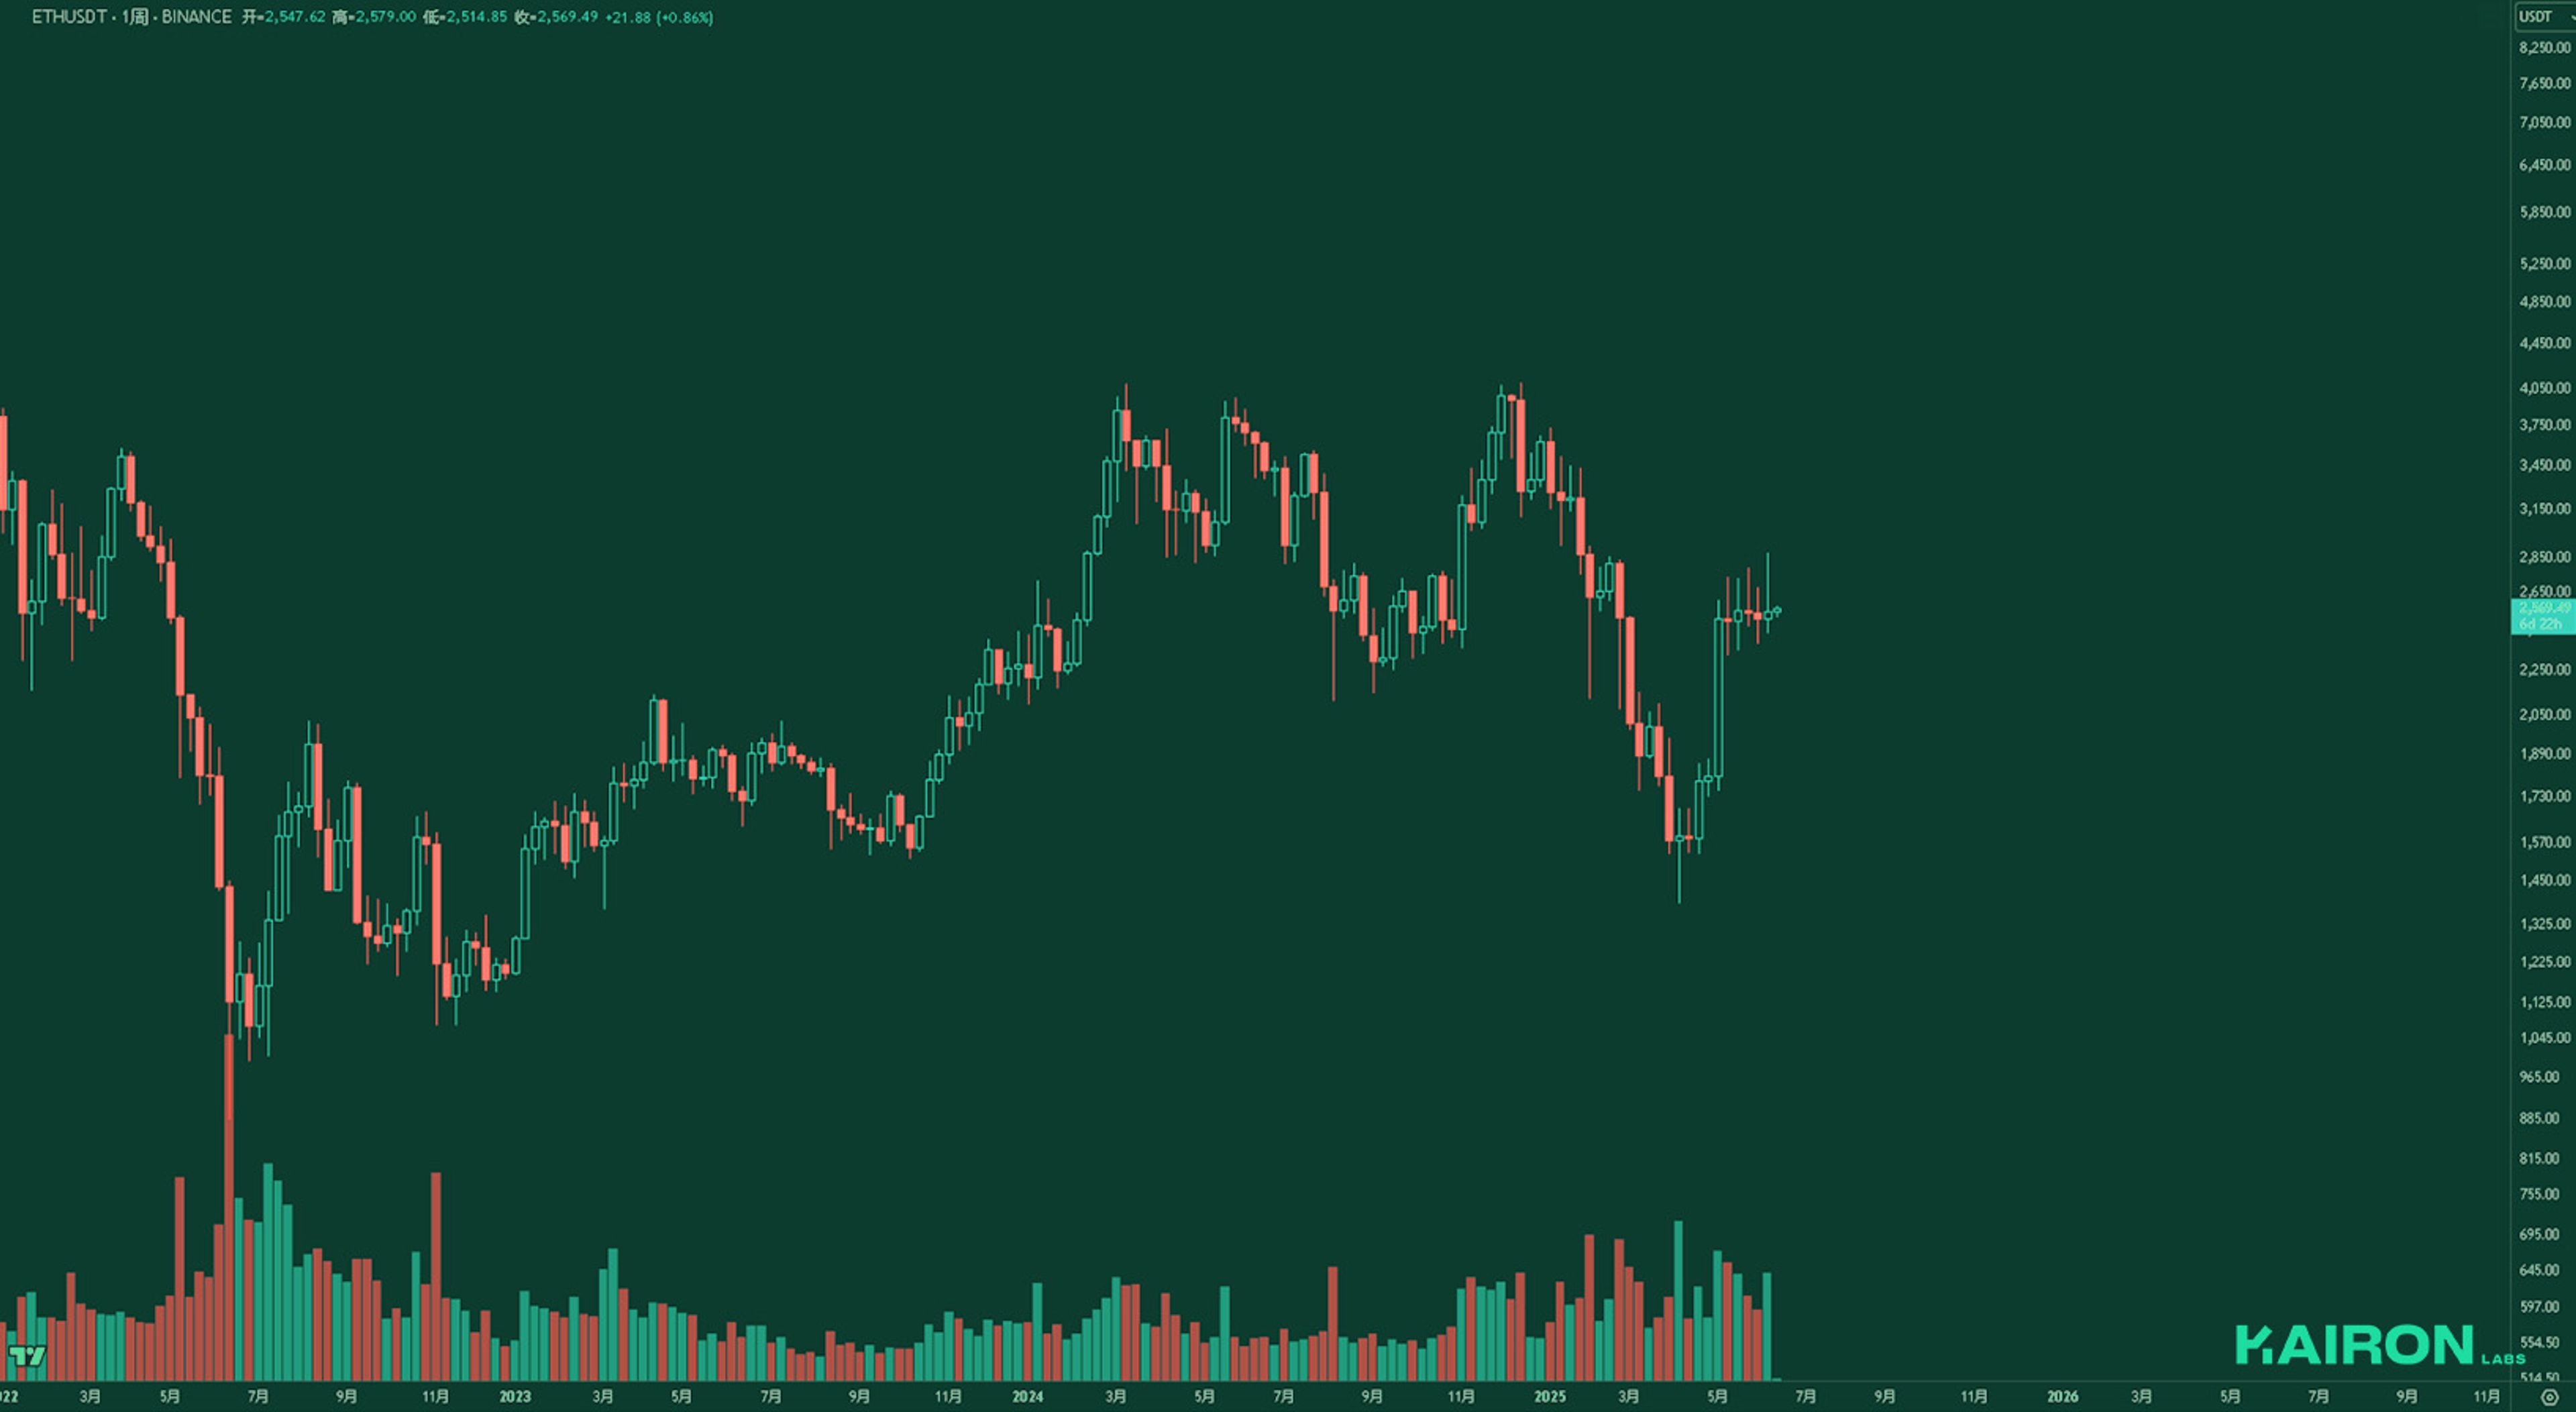
From the weekly chart, ETH has been trading within a tight range for five consecutive weeks. Although the market has been relatively quiet, the overall trend remains bullish.
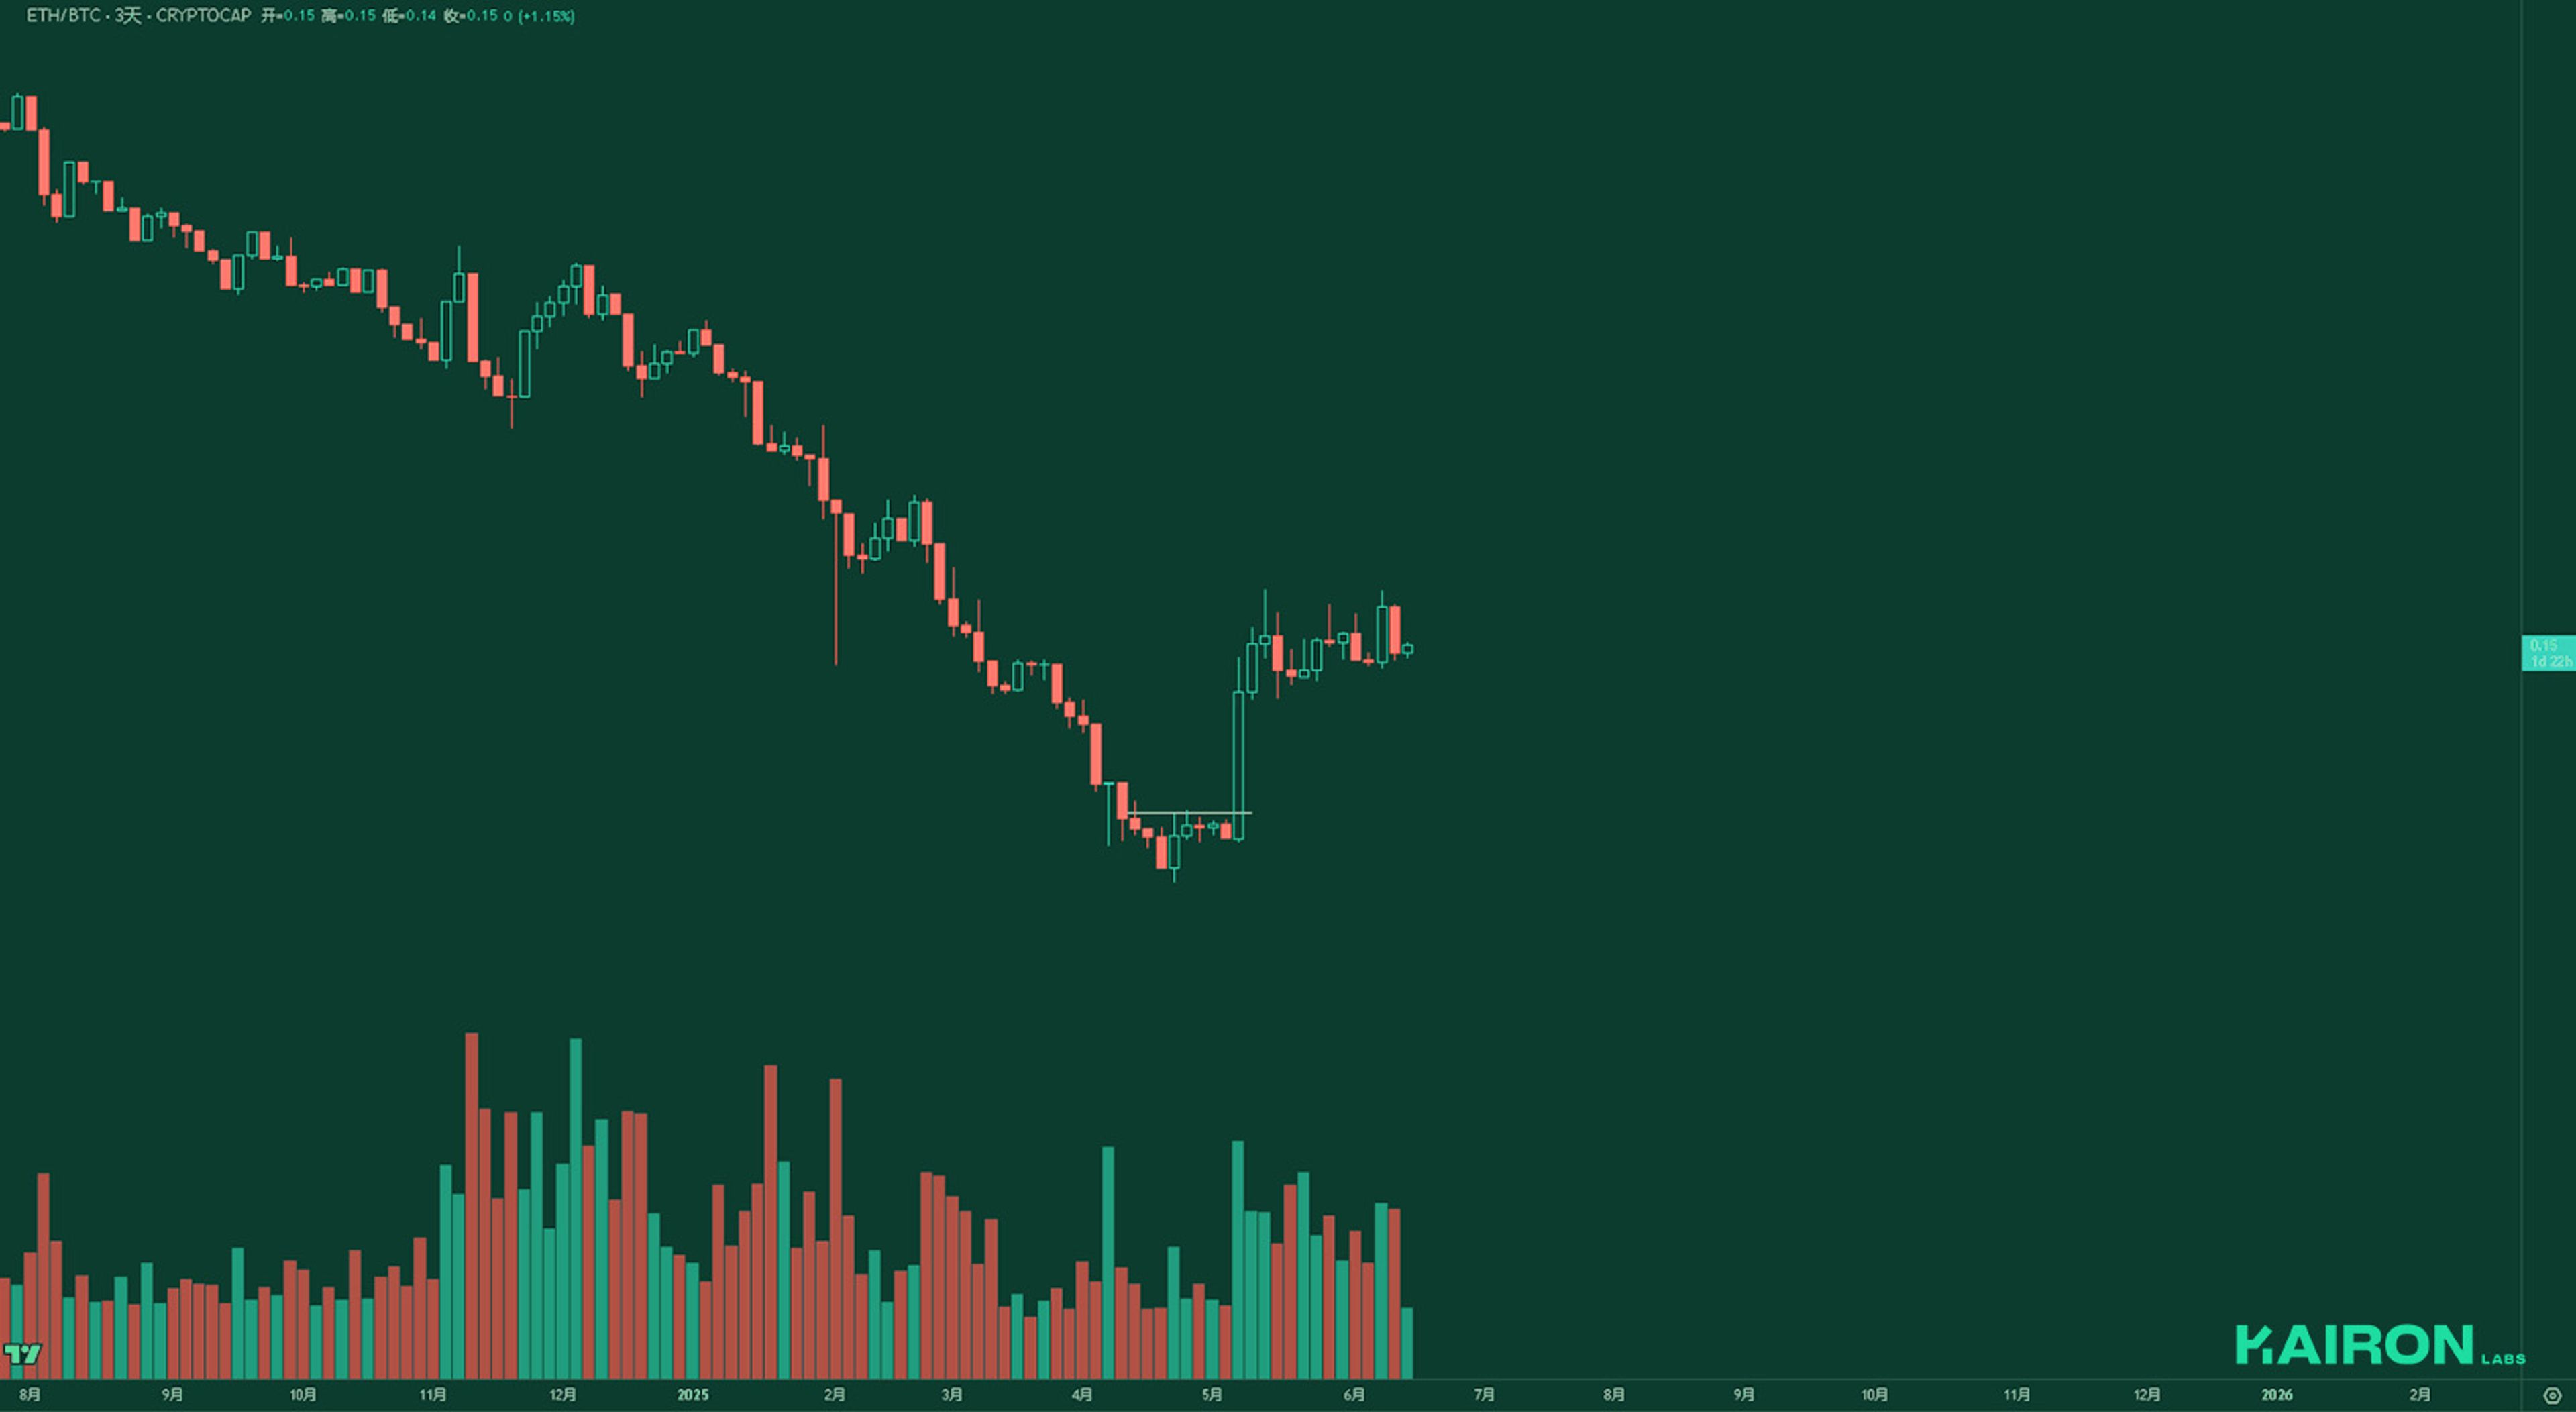
Although ETH/BTC has experienced some volatility, it is still gradually trending upward overall. This could be a case of upward-sloping consolidation.
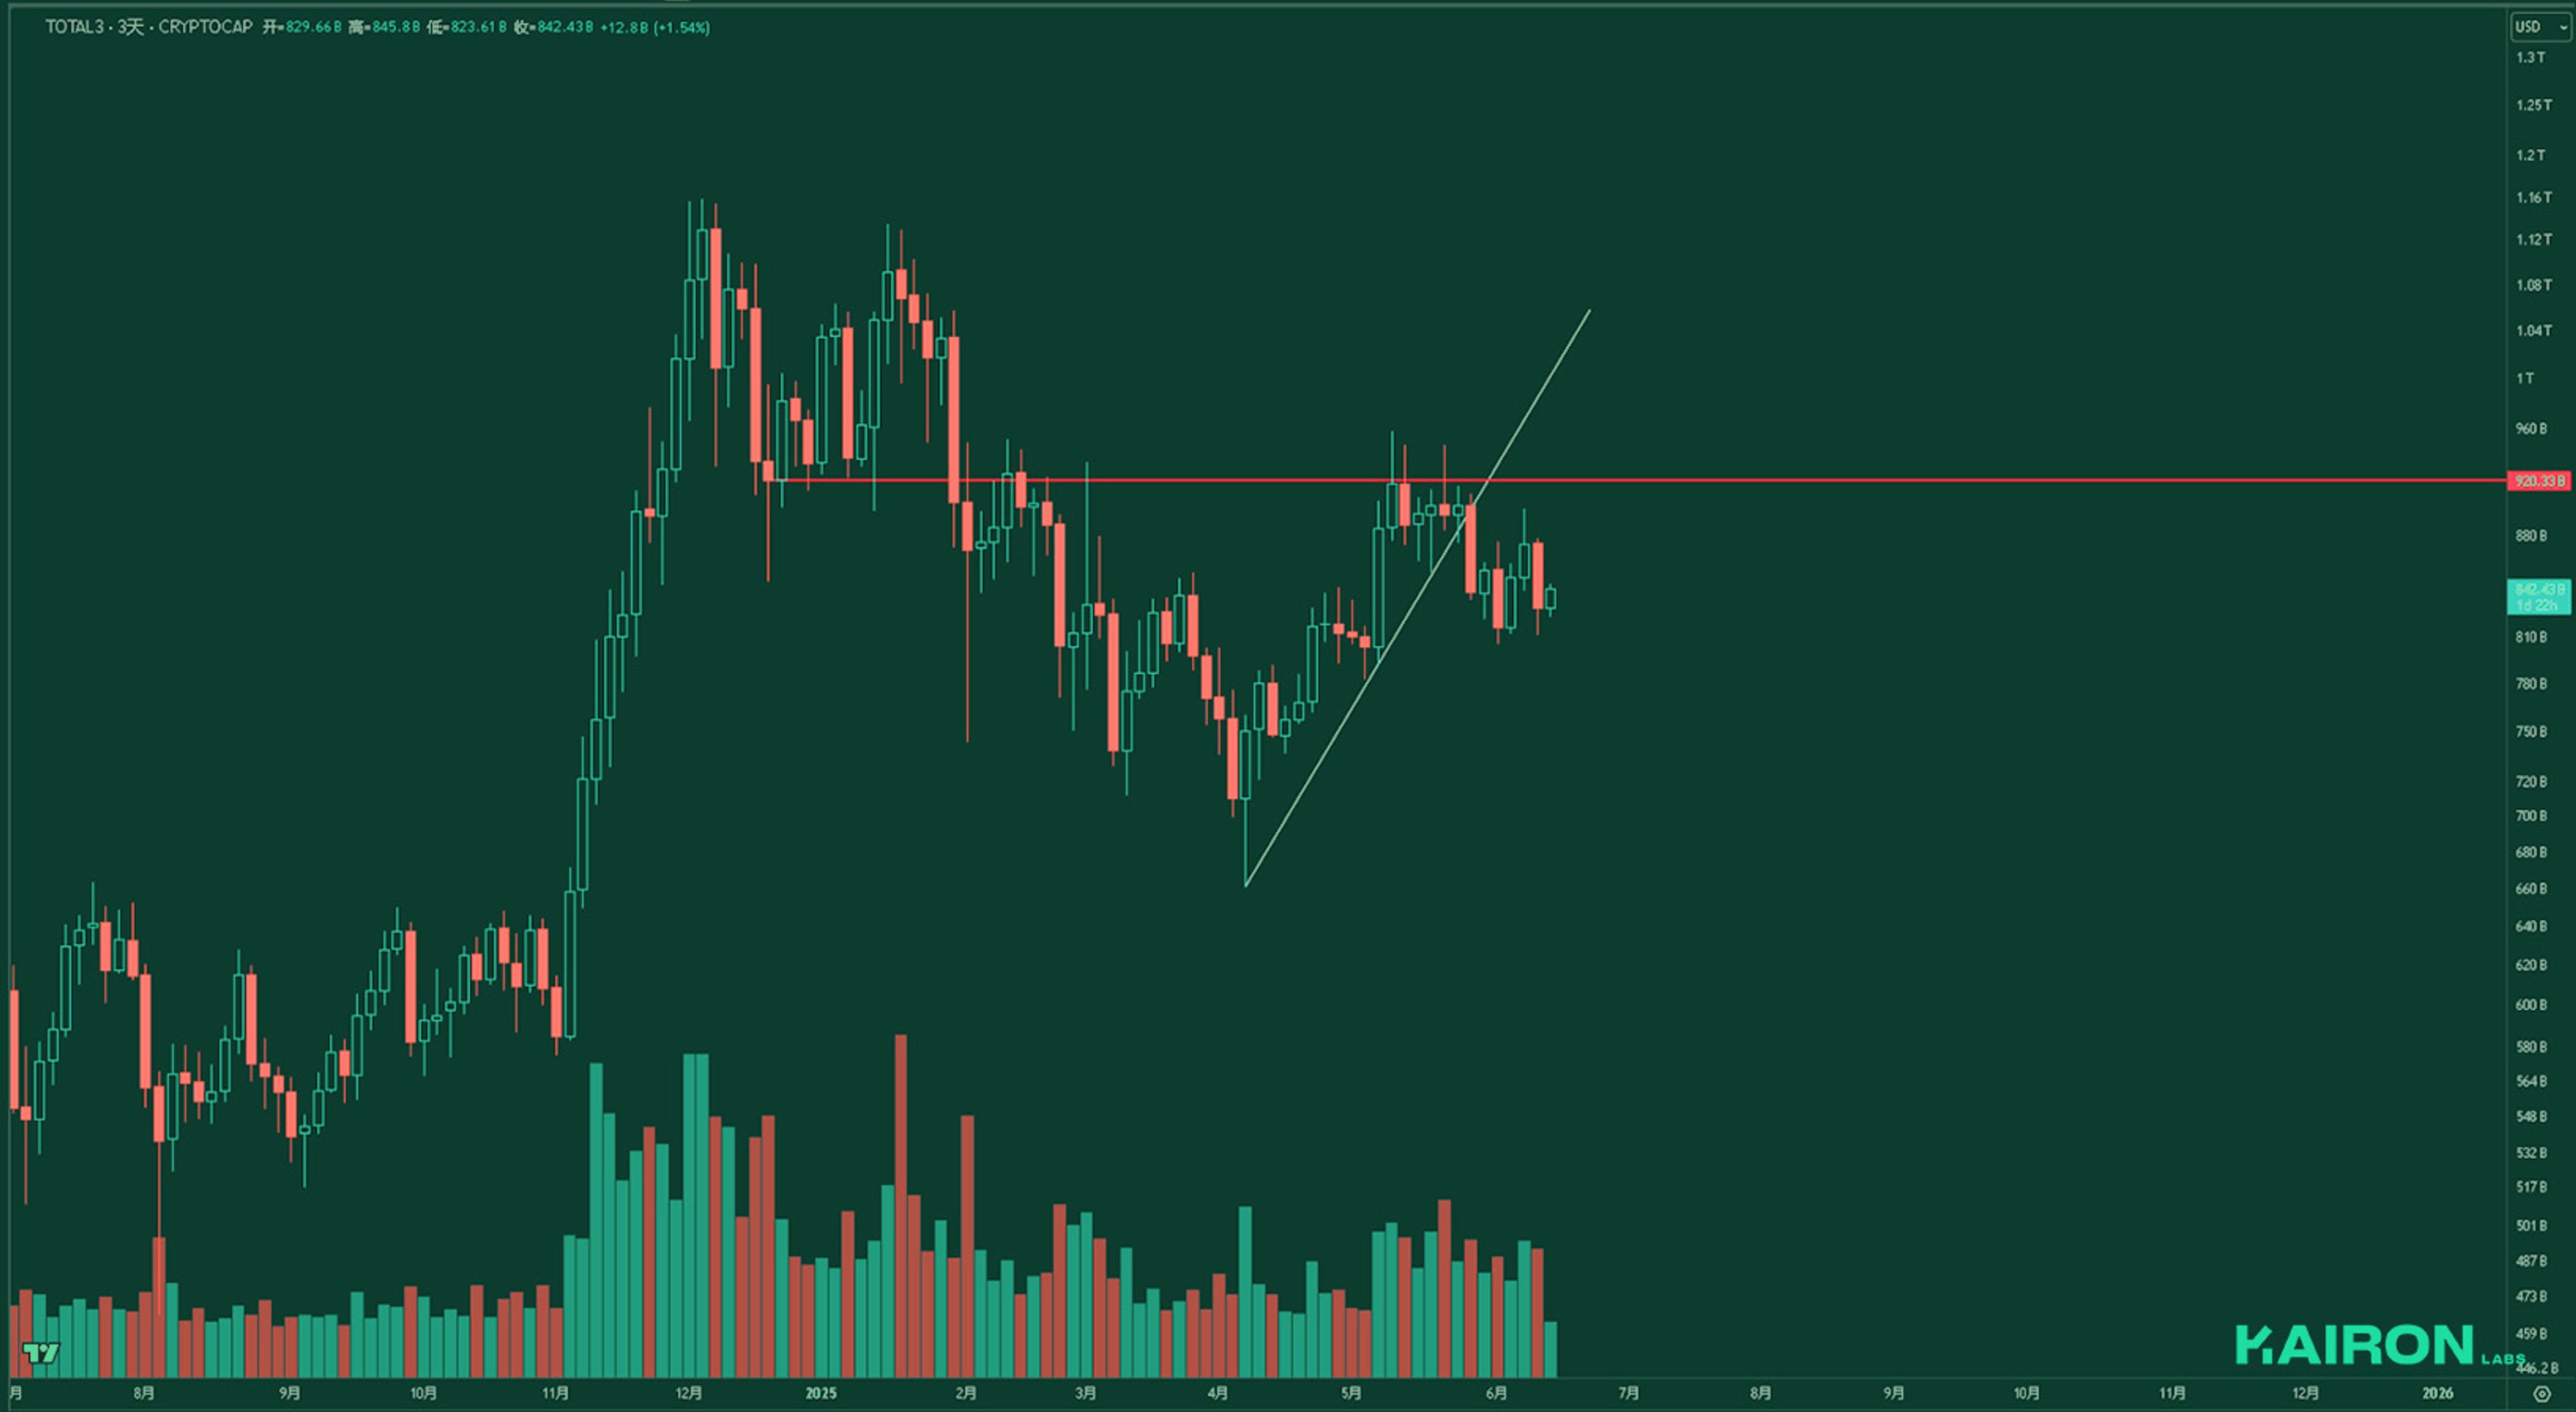
TOTAL3 still appears to lack strong upward momentum. After breaking the short-term rising trendline, price action has remained below the key resistance zone around the 920B level, indicating hesitation from buyers. Despite several attempts, the market has yet to show convincing strength to reclaim higher ground. The recent sideways movement suggests consolidation, but without a clear breakout, upside continuation remains uncertain.
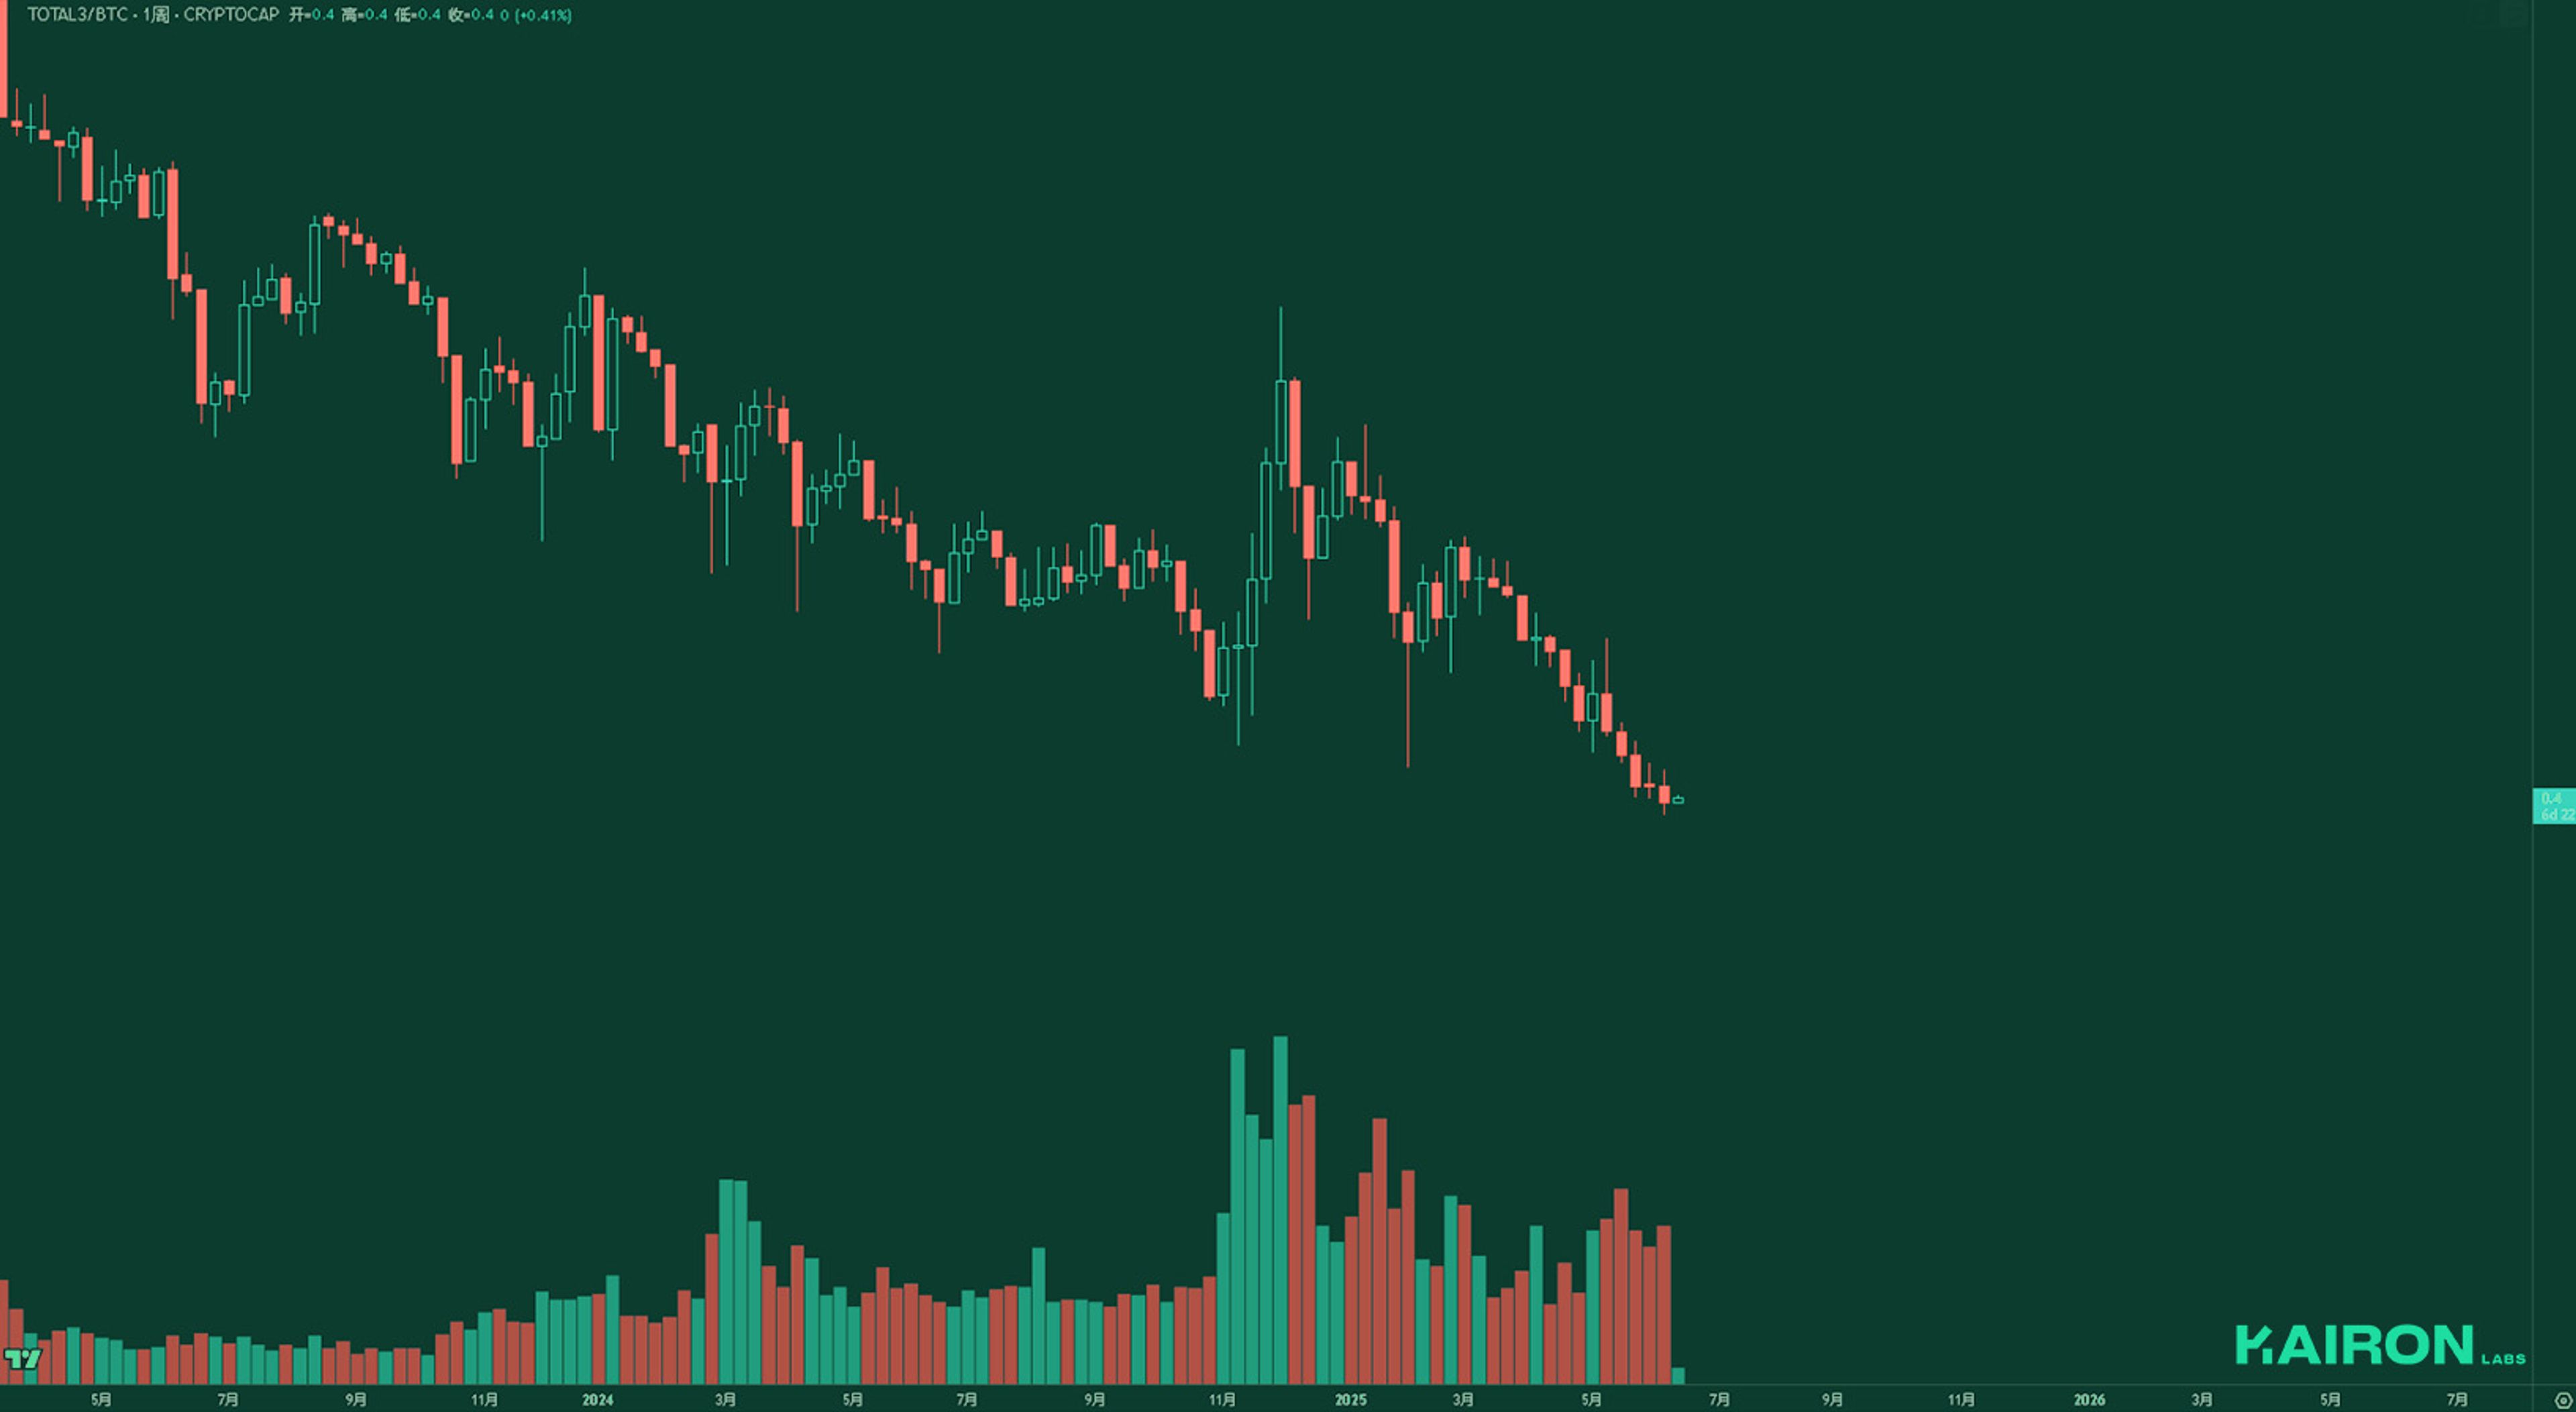
TOTAL3/BTC continues to make new lows, highlighting the persistent weakness of altcoins relative to Bitcoin. This ongoing underperformance suggests that market participants still favor BTC over broader crypto exposure, and it may take a shift in sentiment or renewed risk appetite for altcoins to regain strength.
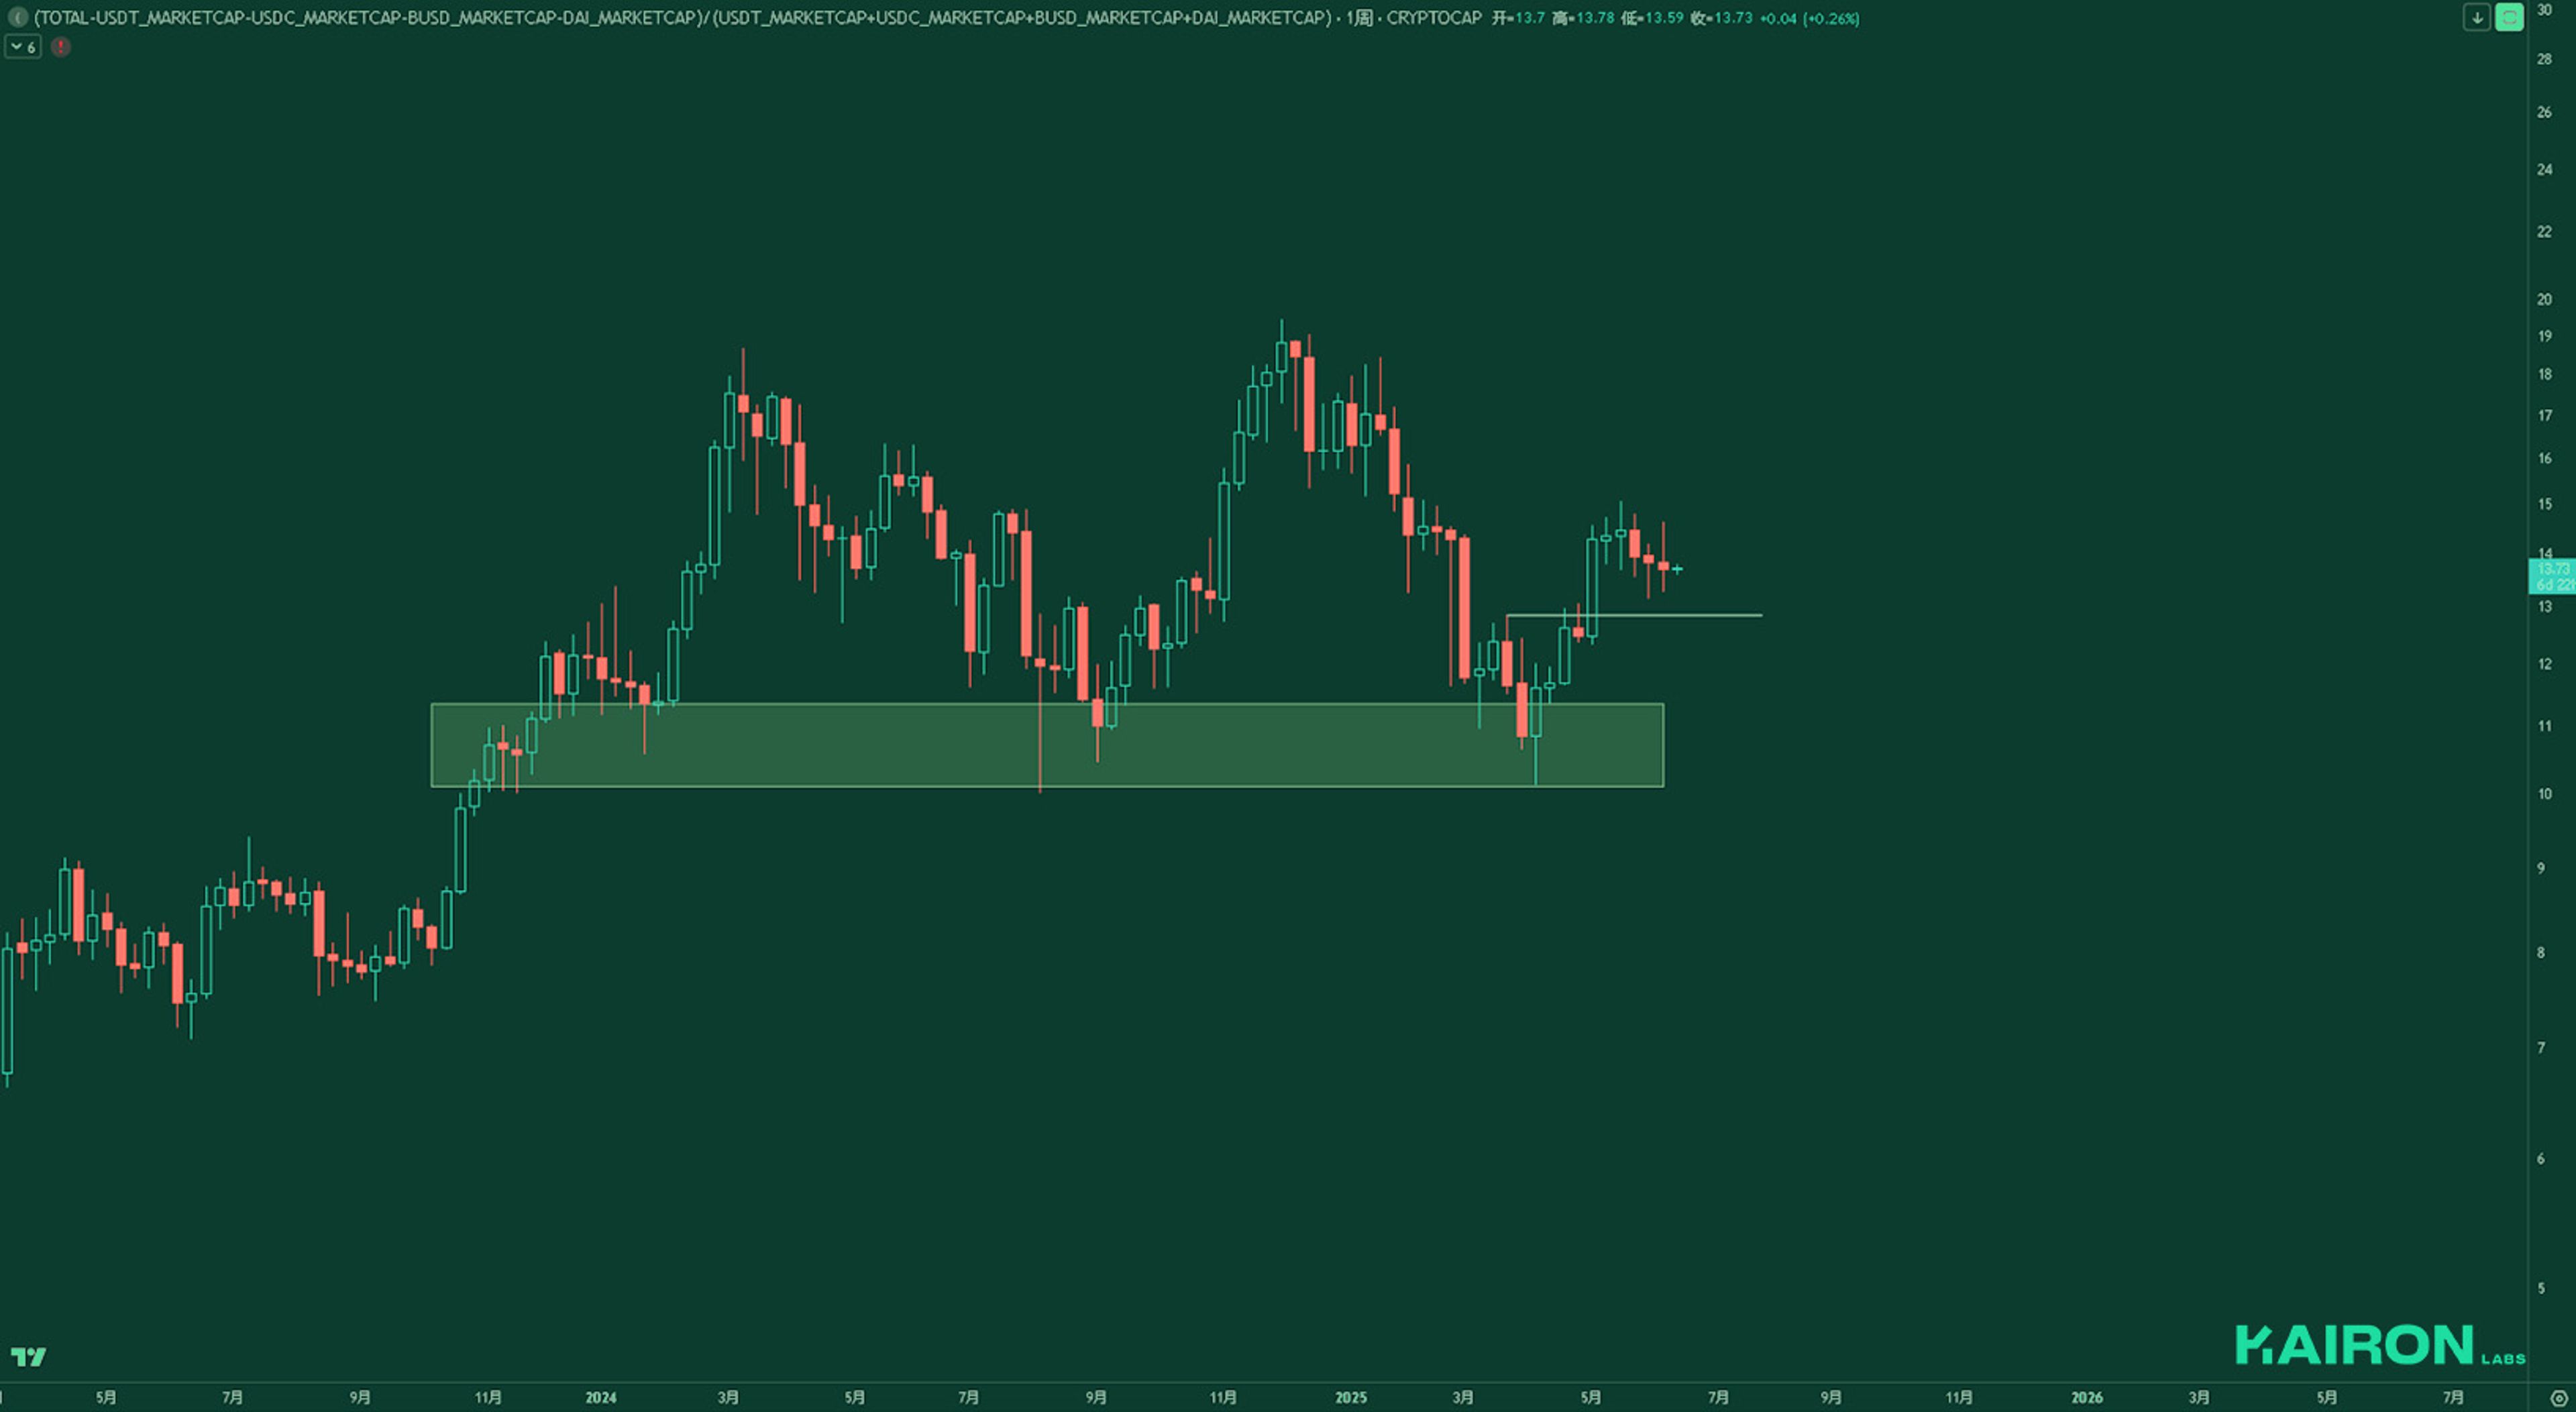
From the weekly chart, the market leverage ratio remains stable, indicating that participants are not aggressively increasing risk. This suggests a wait-and-see attitude; this sideways movement may be forming a base for a potential bullish breakout.
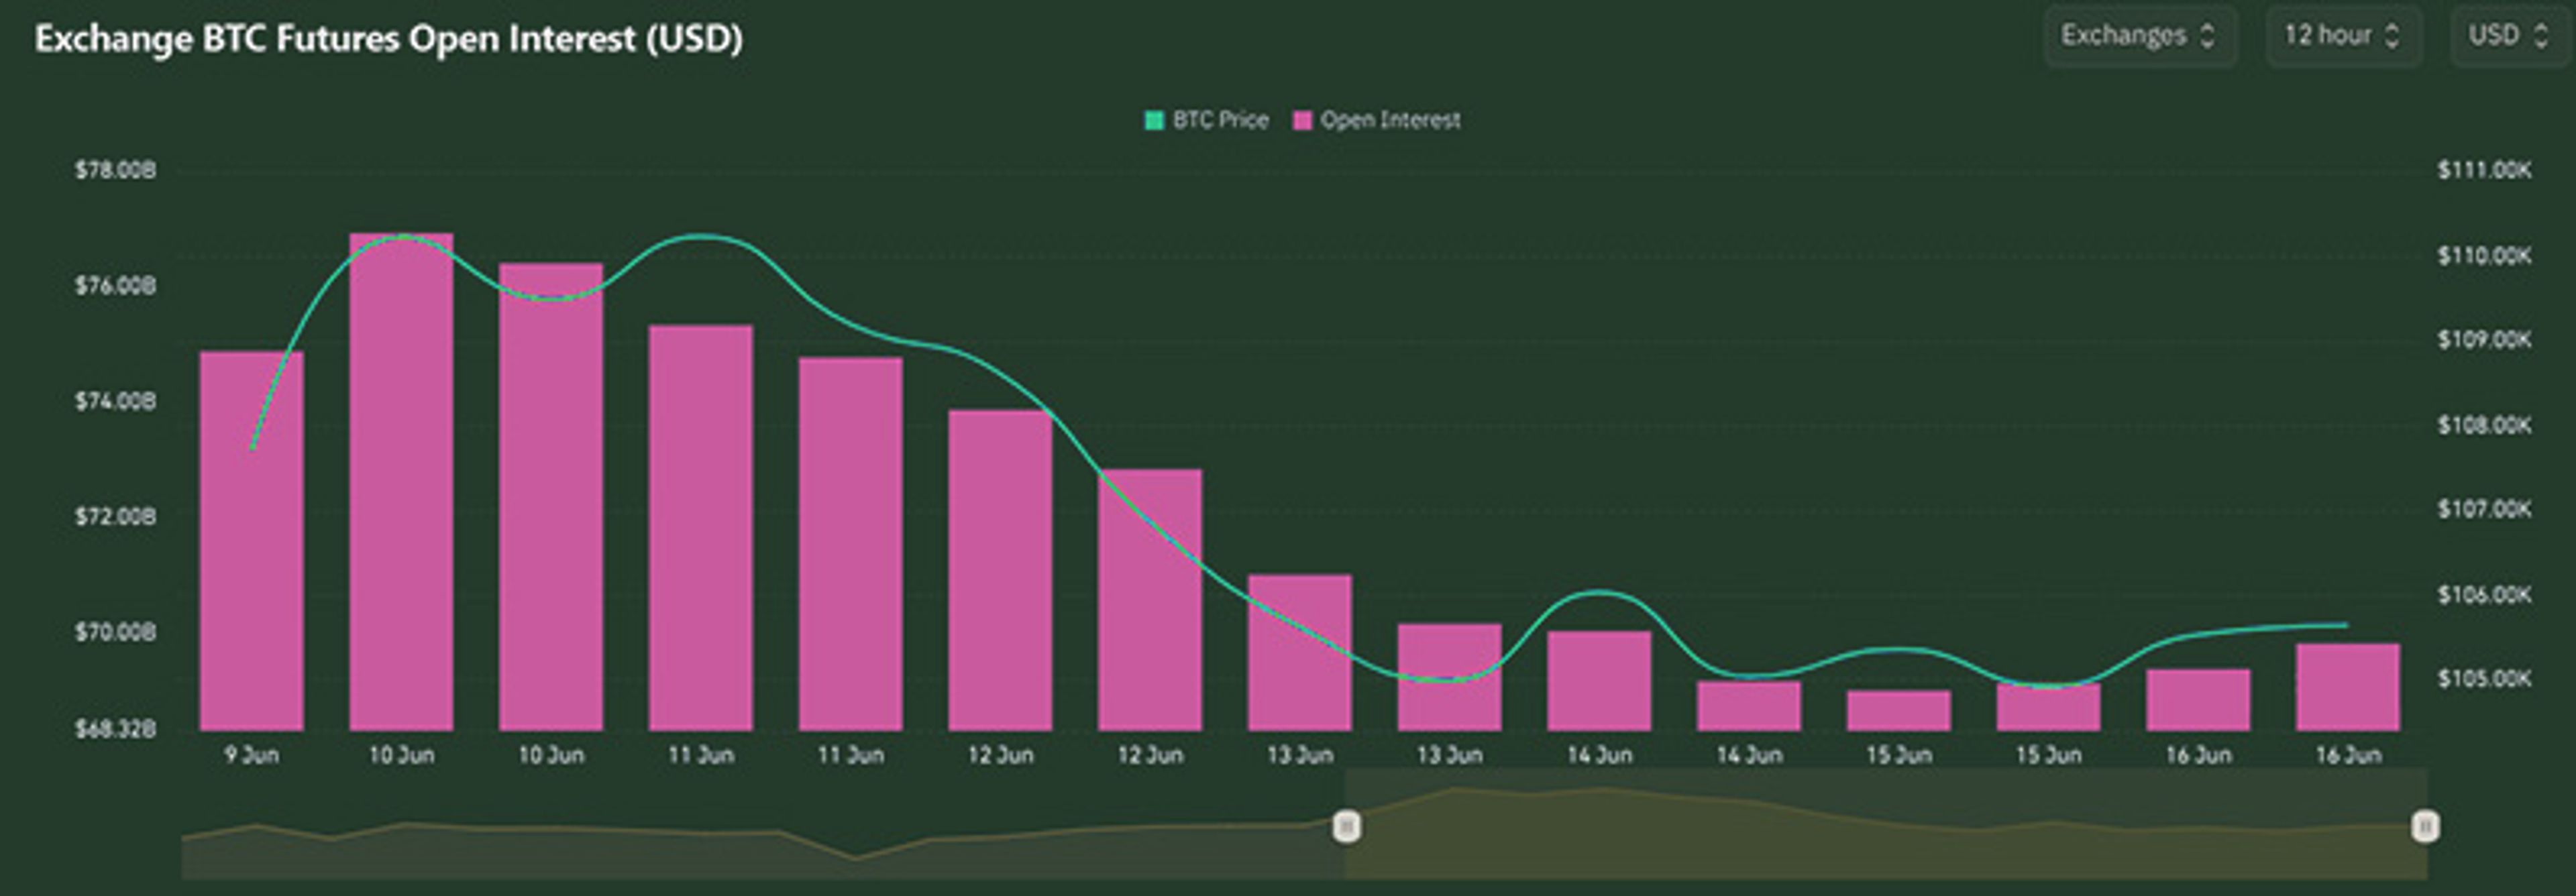
BTC hovered near all-time highs at 110k with Open Interest floating at highs, before geopolitical tensions saw unwinding of positions- OI dropped considerably with the retracement of spot to 105k.
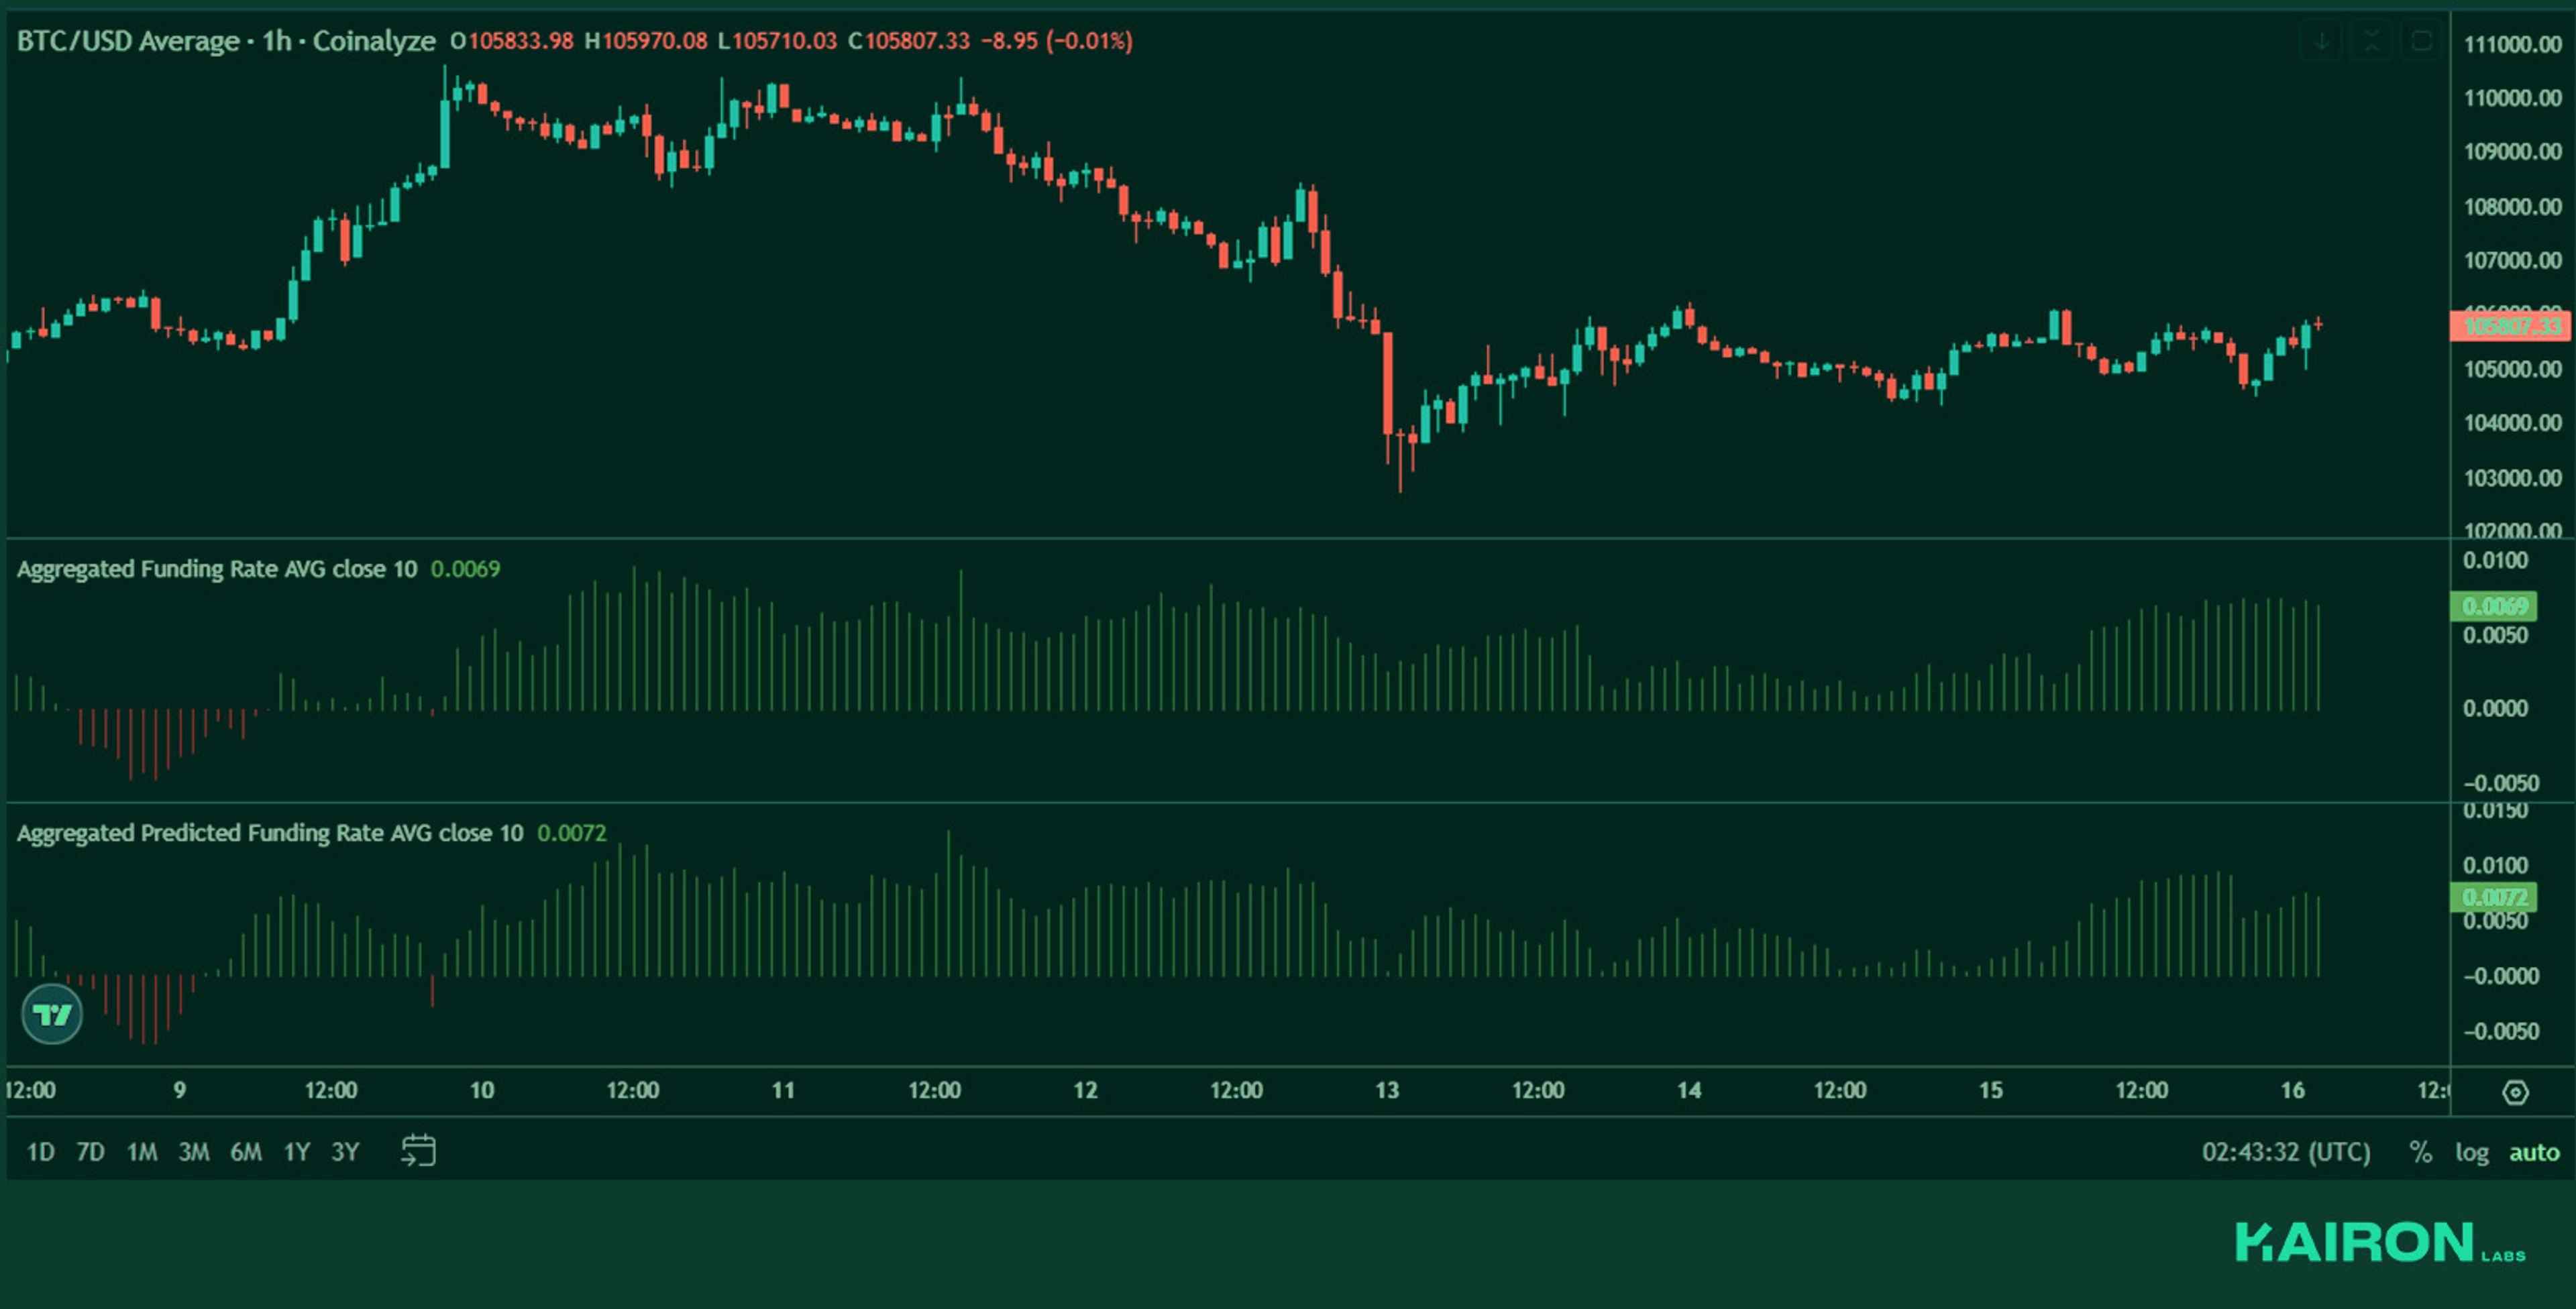
Whilst funding initially decreased as BTC retraced, it has now recovered to the same levels when it was near the highs of the week, indicating a relative continuation of sentiment.
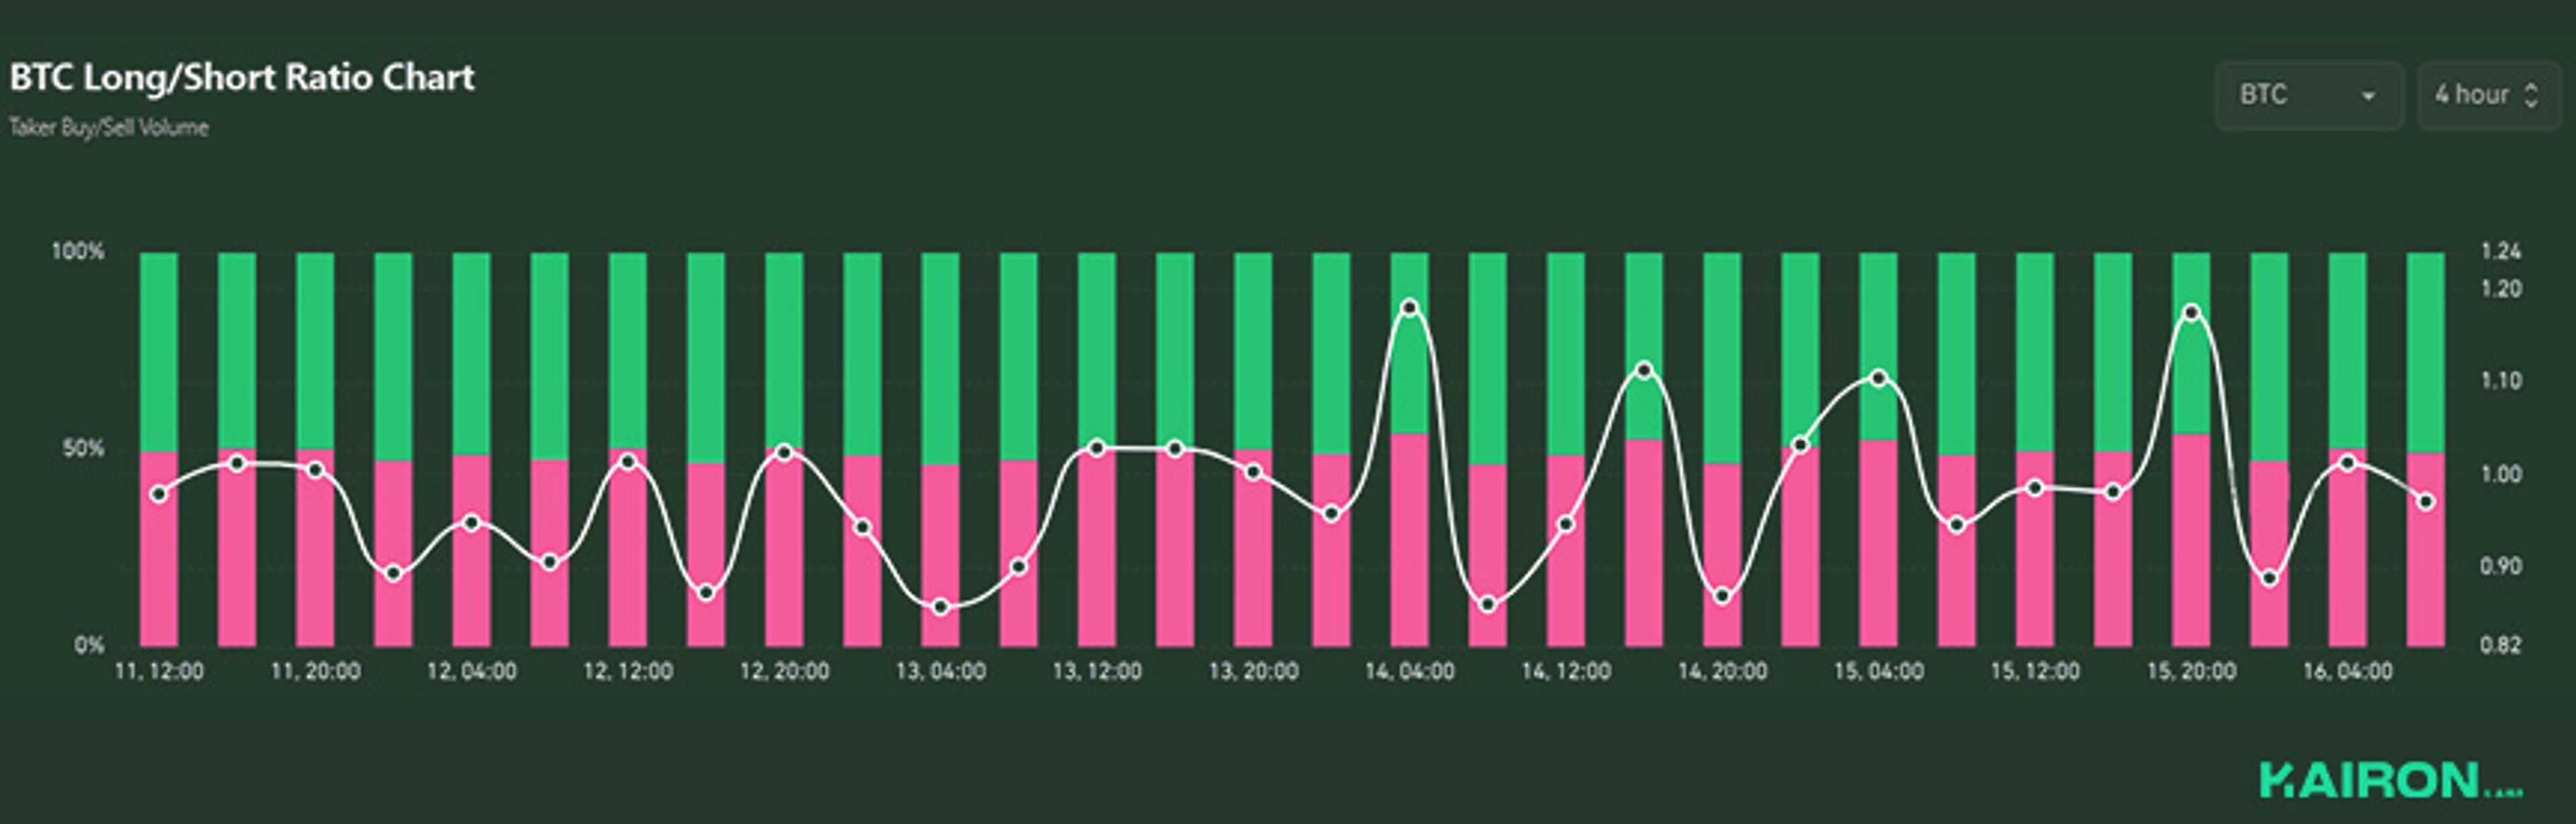
Accounts have mostly been short for the whole week of trading, in contrast to the positive funding we saw, showing clever divergence between capital and accounts.
There could be trapped shorts that lead to an impulse move to the upside from such a setup.
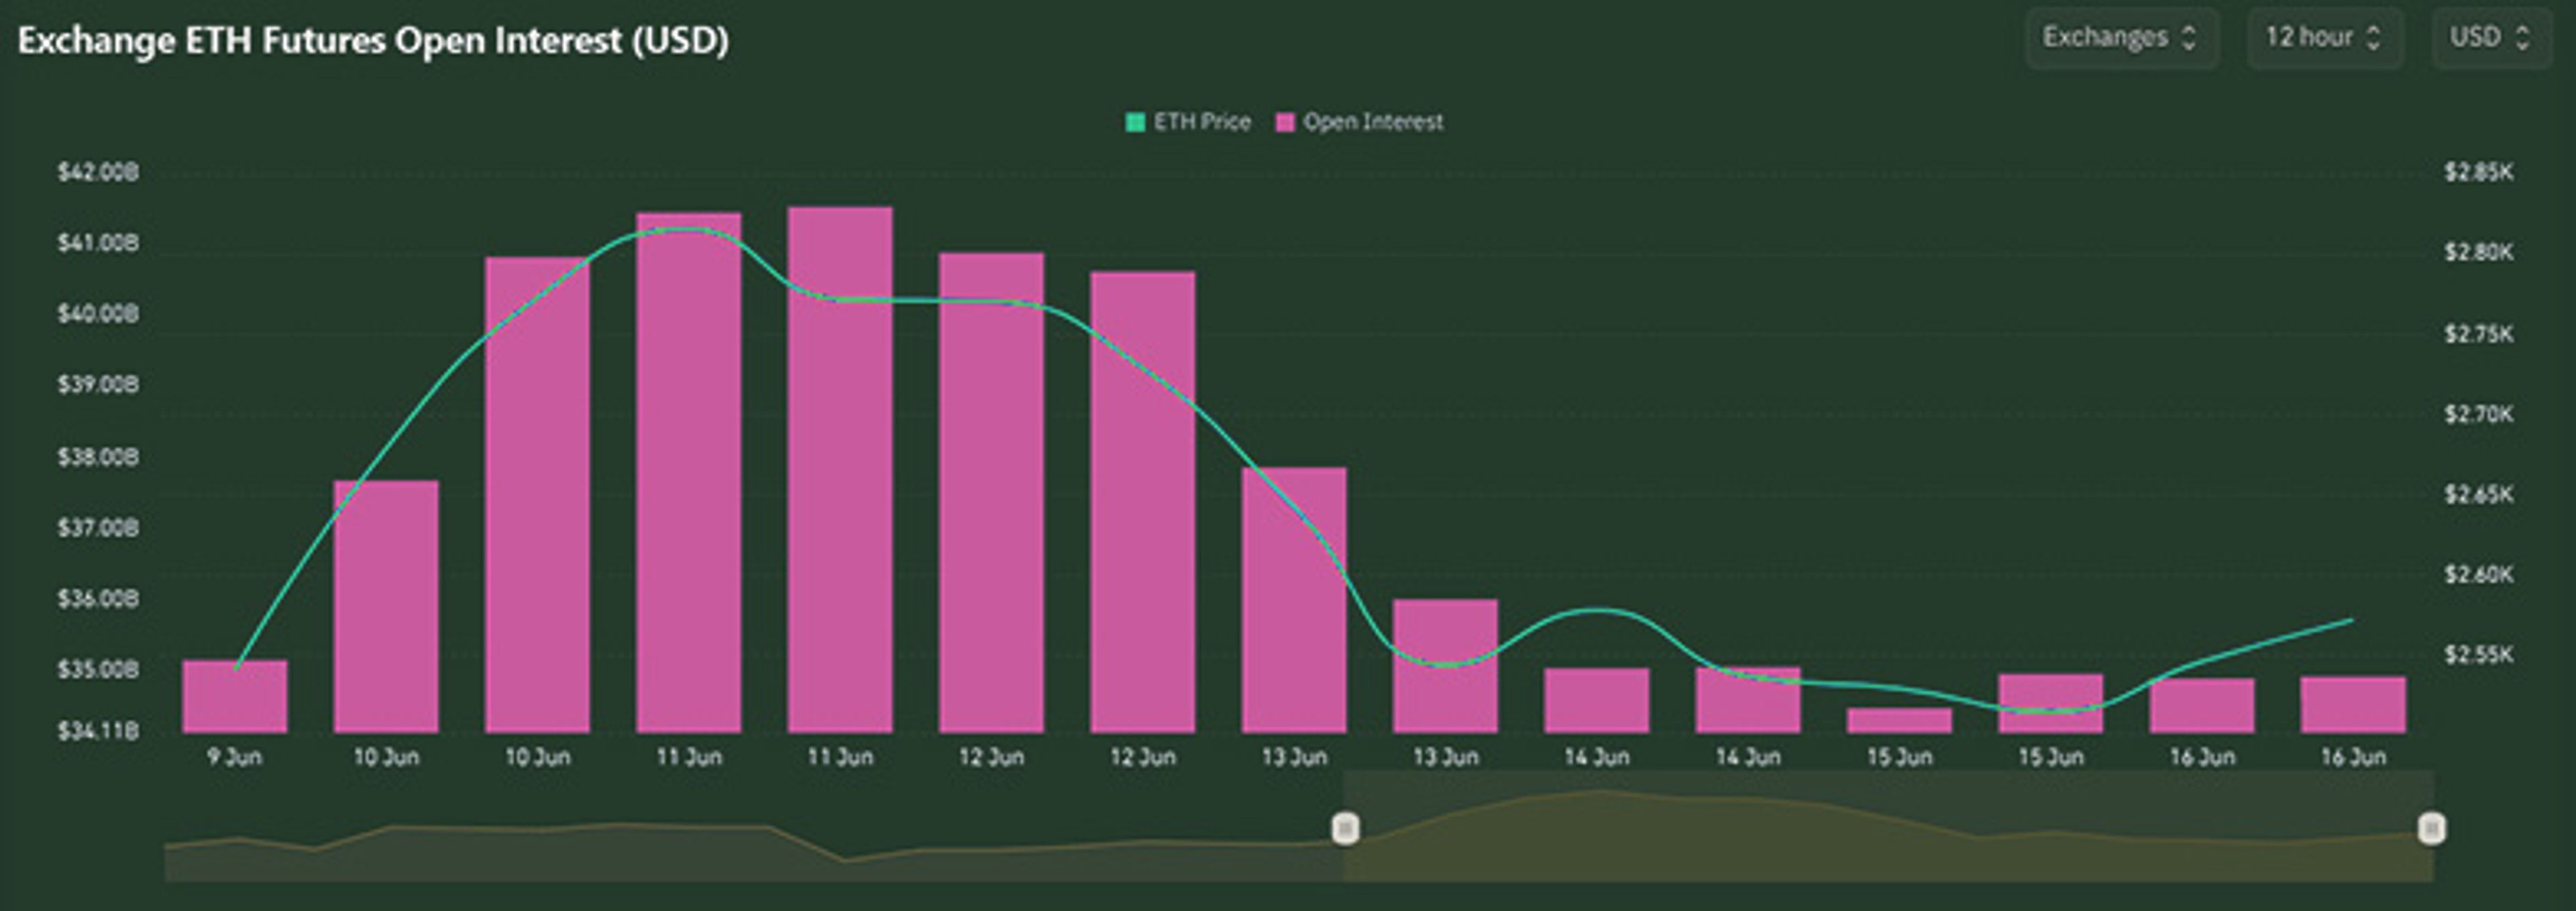
Open Interest increased as ETH rallied to 2.8k, before retracing with the price, echoing the market-wide retracement from the Iran-Israel conflict.
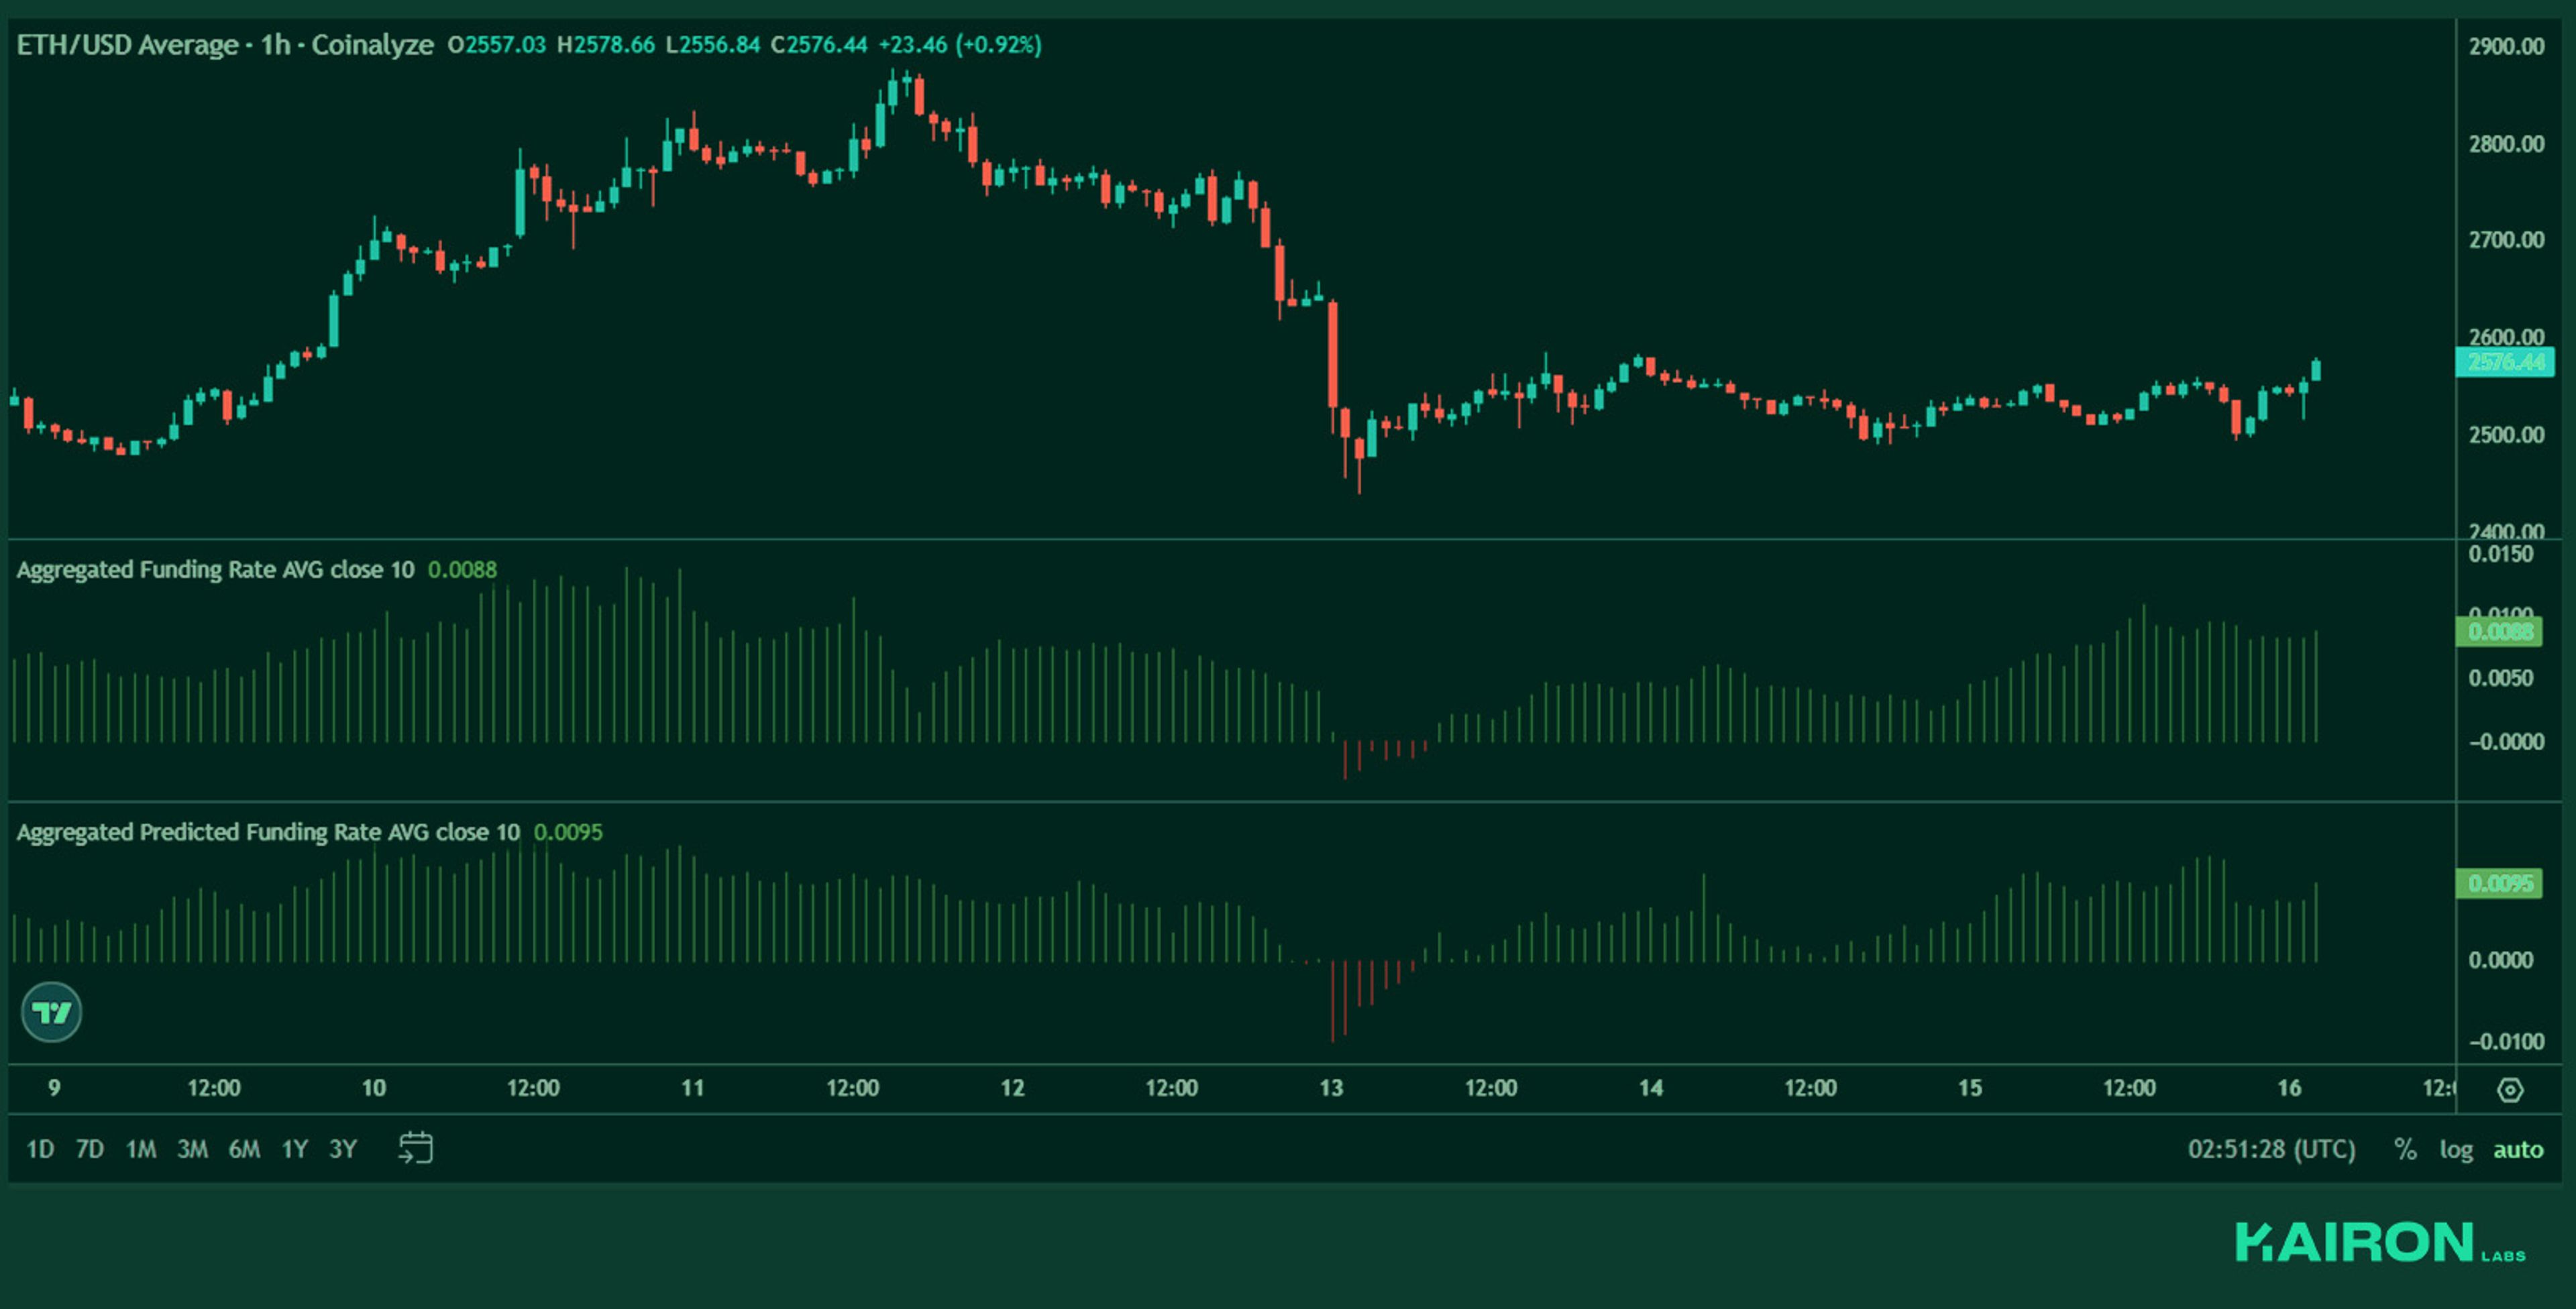
Funding dipped briefly before building back to near the bullish 0.01 levels. Sentiment for ETH remains structurally bullish, with funding flirting with 0.01 levels from time to time.
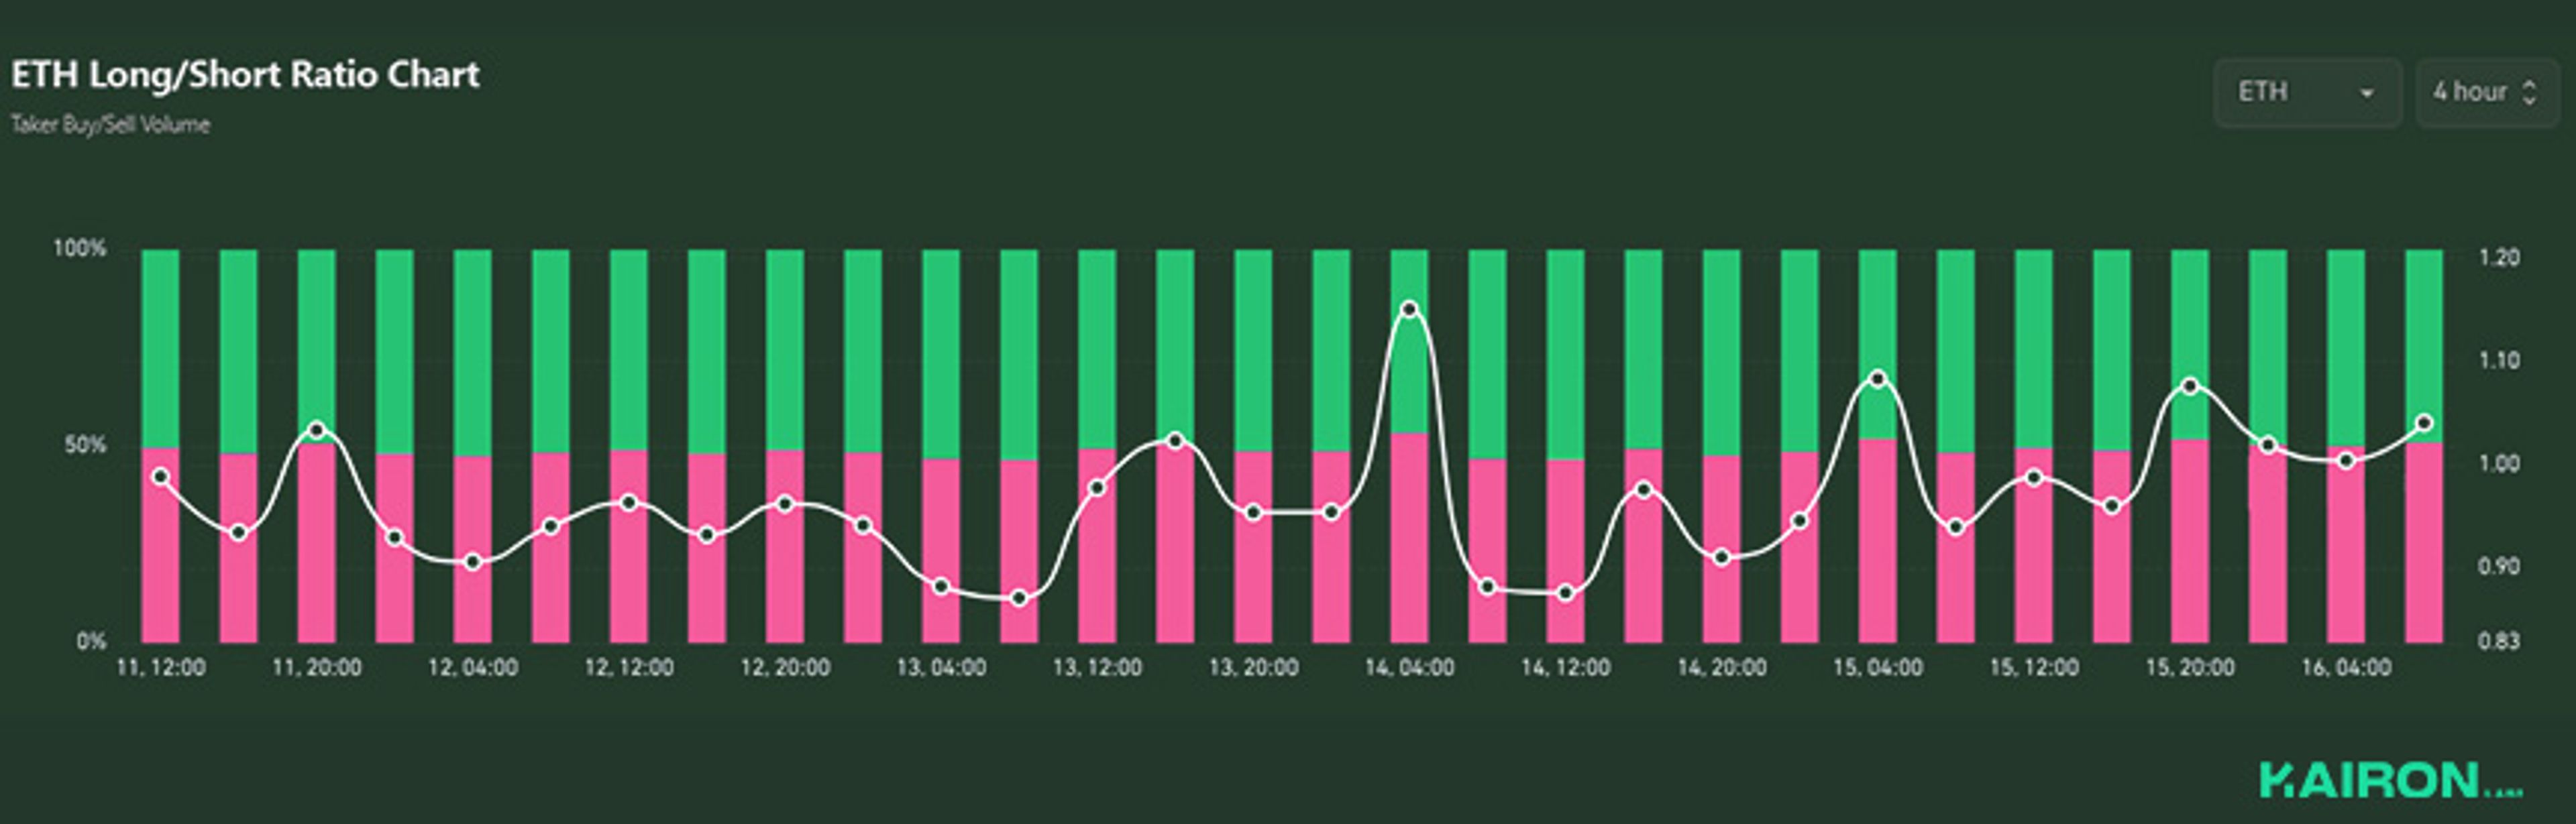
Similarly, accounts have mostly been short for the whole week of trading, in contrast to the positive funding we saw, showing clever divergence between capital and accounts.
There could be trapped shorts that lead to an impulse move to the upside from such a setup.
The week opened with optimism as the U.S. and China finally reached a trade deal, sending stocks and crypto higher. But the mood shattered when Israel attacked Iran's nuclear facilities, triggering missile strikes and threats of escalation.
Oil prices surged as tensions flared, while investors fled risky assets. The sudden conflict erased earlier gains, leaving markets stuck between two competing forces - the promise of easing trade wars and the peril of expanding Middle East violence.
With geopolitical risks back in focus, traders are bracing for more turbulence ahead.
DISCLAIMER:
The information in this report is for information purposes only and is not to be construed as investment or financial advice. All information contained herein is not a solicitation or recommendation to buy or sell digital assets or other financial products.
This post was prepared by Kairon Labs Trader Patrick Li, Travis Su, and Kenny Lee.
Edited by: Marianne Dasal
Kairon Labs provides upscale market-making services for digital asset issuers and token projects, leveraging cutting-edge algorithmic trading software that is integrated into over 100+ exchanges with 24/7 global market coverage. Get a free first consult with us now at kaironlabs.com/contact